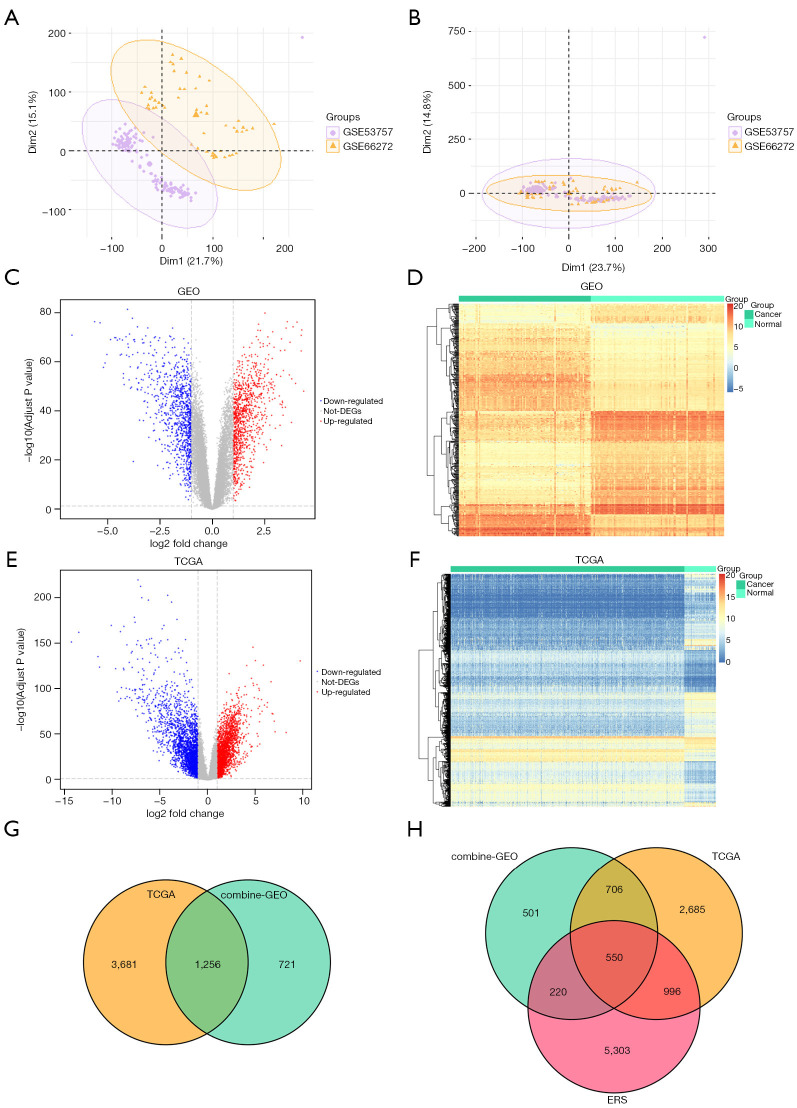
Figure 1.
Differentially expressed genes. (A) PCA analysis before batch calibration. (B) PCA analysis after batch calibration. (C,E) The abscissa is the log2 fold change; the ordinate is −log10 (adjusted P value). (D,F) The abscissa is the patient id; the ordinate is the respective DEGs. (G) Venn diagram of the DEGs; the green circle represents the DEGs of the integrated GEO data set; the yellow circle represents the DEGs of TCGA data set. The intersection was used to identify the ccRCC-related DEGs. (H) The yellow circle represents the DEGs of TCGA data set; the green circle represents the DEGs of the integrated GEO data set; the red circle represents the ERS-related genes of ccRCC. PCA, principal component analysis; DEGs, differentially expressed genes; GEO, Gene Expression Omnibus; TCGA, The Cancer Genome Atlas; ERS, endoplasmic reticulum stress; ccRCC, clear cell renal cell carcinoma.

