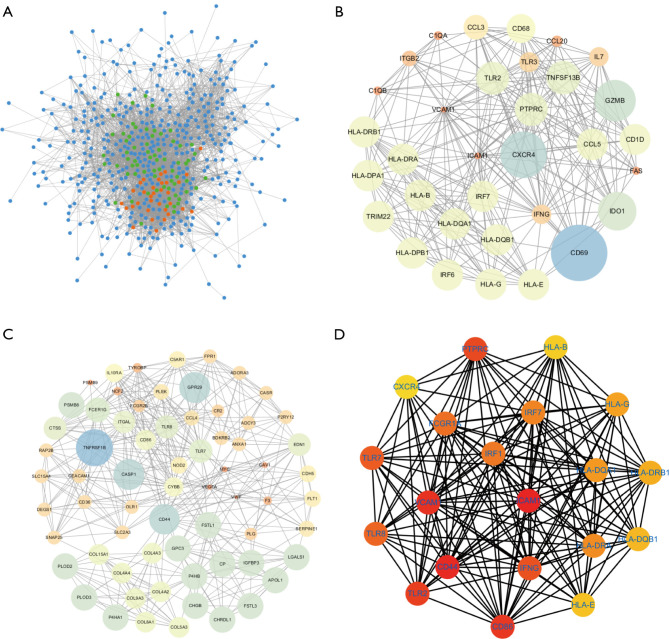
Figure 5.
PPI network. (A) PPI network of the DEGs related to renal clear cell carcinoma; the blue nodes indicate the DEGs related to renal clear cell carcinoma; the red nodes indicate the first subnet gene; the green nodes indicate the second subnet gene. (B) The first subnet in the PPI network of the DEGs related to renal clear cell carcinoma; the size of the node represents the MCODE score. (C) The first subnet in the PPI network of the DEGs related to renal clear cell carcinoma; the size of the node is the MCODE score. (D) Top 20 subnets in the PPI network of the DEGs related to renal clear cell carcinoma. PPI, protein-protein interaction; DEGs, differentially expressed genes; MCODE, Molecular Complex Detection.

