FIGURE 2.

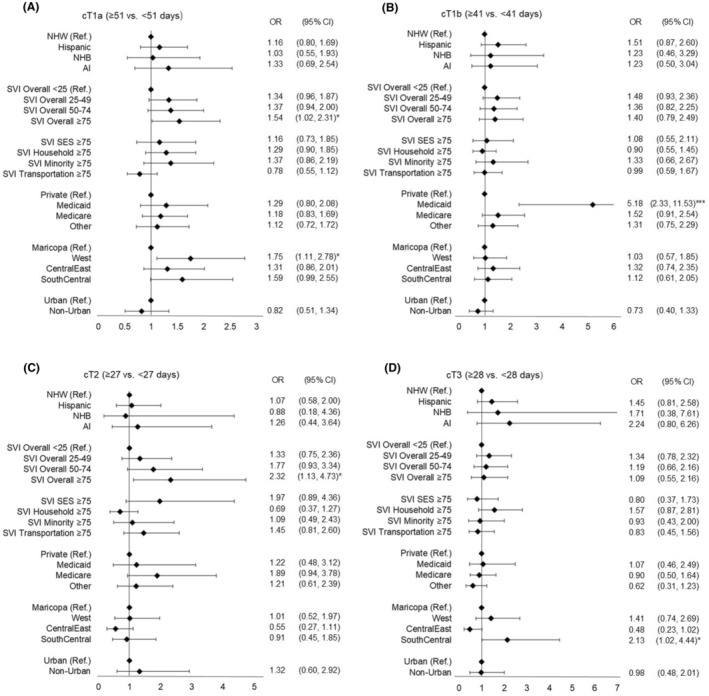
Factors associated with the longer time to surgical treatment in adjusted models. (A) cT1a (≥50 vs. <51 days), (B) cT1b (≥41 vs. <41 days), (C) cT2 (≥27 vs. <27 days), and (D) cT3 (≥28 vs. <28 days).

Factors associated with the longer time to surgical treatment in adjusted models. (A) cT1a (≥50 vs. <51 days), (B) cT1b (≥41 vs. <41 days), (C) cT2 (≥27 vs. <27 days), and (D) cT3 (≥28 vs. <28 days).