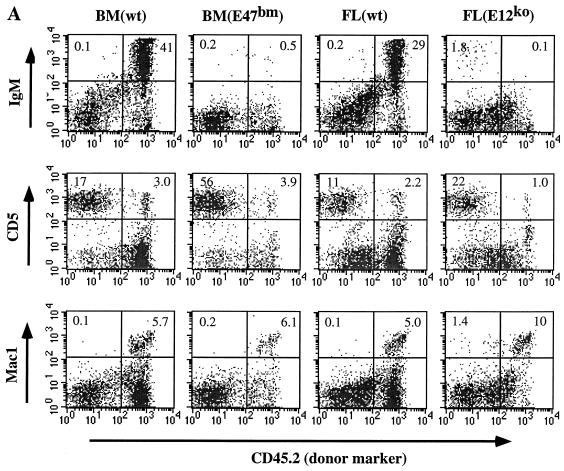
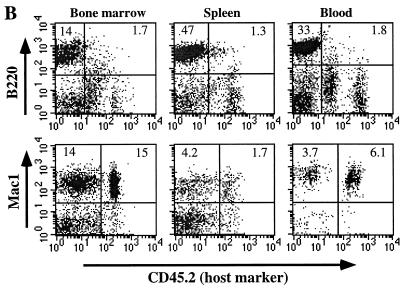
FIG. 4.
(A) FACS analysis of spleen samples from stem cell transfusion experiments. Sources of donor stem cells are indicated at the top (BM, bone marrow; wt, wild type; FL, fetal liver). Each vertical panel represents separate FACS analysis for B cells (IgM), T cells (CD5), and myeloid cells (Mac1) from the same splenic sample. CD45.2 (Pharmingen) is an allotype marker that is present on the donor cells and absent on host cells. To eliminate nonspecific staining and dead cells, 7AAD was also included in all the staining reactions. Percentages of cells given in the quadrants are calculated based on total live cells rather than the size-gated population. Data are representative of two to five independent transfusion tests for each donor type. (B) FACS analysis of an E47bm mouse (representative of three mice) reconstituted with the wild-type HSC. Cells from bone marrow, spleen, and blood were analyzed with a B-cell marker (B220) and a myeloid cell marker (Mac1). Donor cells were derived from wild-type C57BL/6Ly5A mice and were negative for CD45.2, whereas host cells were positive for the CD45.2 marker. Gating and data presentation are as in panel A.


