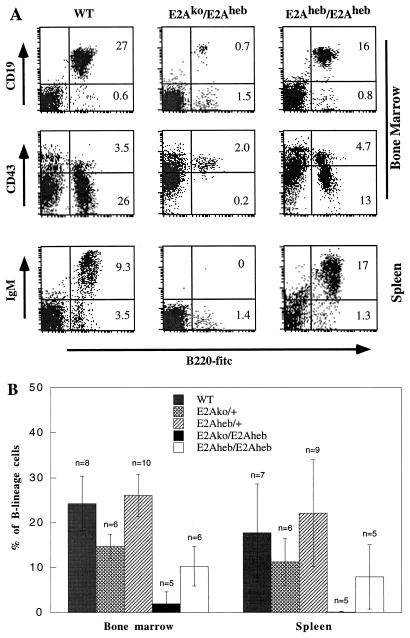
FIG. 6.
(A) FACS analysis of mice carrying one or two copies of E2Aheb. Bone marrow (top two panels) and spleens (bottom panel) from 10-day-old wild-type (WT), E2Ako/E2Aheb transheterozygous, and E2Aheb homozygous mice were analyzed with B-cell markers. Plots were gated on live lymphocytes based on cell size and 7AAD staining. Percentages of cells shown in the quadrants represent the fractions of total live cells analyzed. (B) B-cell contents as a percentage of total live suspension cells for the five genotypes. Percentages of B cells in bone marrow and spleen are calculated based on the analysis of multiple litters with ages ranging from 1 to 3 weeks. Sample size and standard deviation are shown with each data bar. Relatively large standard deviations for most spleen samples are due to a sharp increase of B-cell content in the first 3 weeks of postnatal life.

