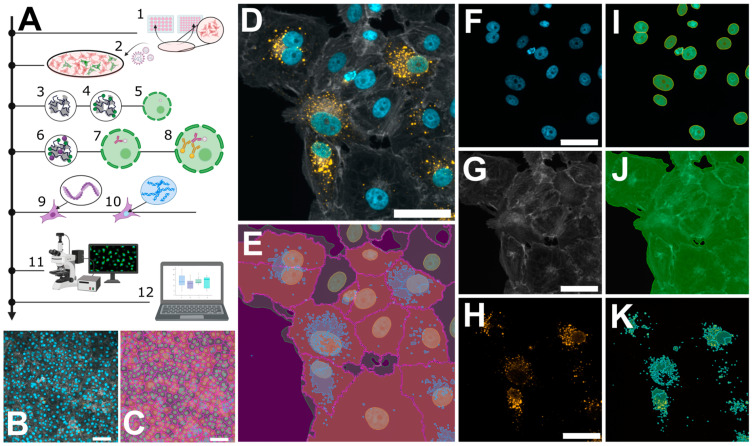
Figure 2.
Microscopic workflow for quantifying orthohantavirus infection in cell culture. (A) Schematic overview of the protocol: cell seeding (1); infection with orthohantavirus for 1 h (2); cell fixation with paraformaldehyde (PFA) (3); blocking of unreacted aldehydes with glycine solution (4); permeabilization with Triton X-100 (5); blocking of unspecific binding sites using a BSA-containing buffer (6); staining with primary antibody against viral nucleocapsid protein (N) (7) and staining with a secondary antibody (8); phalloidin staining to label filamentous actin (9) and Hoechst for labelling dsDNA (10); and imaging via fluorescence microscopy (11) and analysis via custom software tools (12). (B,C) Exemplary images recorded with 20× magnification, showing ~500 cells. (D–K) Pairwise original images together with their masks resulting from software-based segmentation. (D) A merged image of three individual channels in (F–H): Hoechst (F) and its mask for nuclei recognition (I); phalloidin staining (G) for recognizing cell bodies or cell boundaries; and Anti-N staining (H) to reveal viral particles (K). The overlay of (I–K) is shown in (E). Scale bars = 50 µm.

