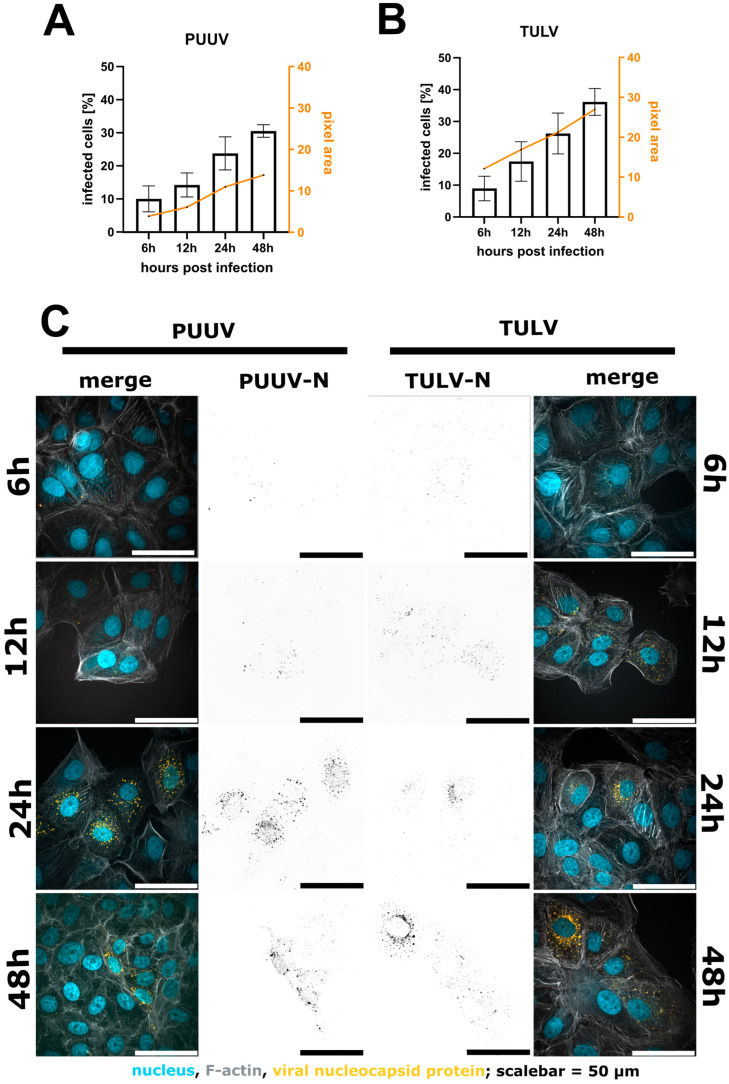
Figure 3.
Quantification of infected Vero E6 cells 6 h, 12 h, 24 h and 48 h post-infection with either PUUV (A) or TULV (B). A comparison of the percentage of infected cells shows an increase in detected cells after 48 h compared to 6 h. We observed a correlation between the number of infected cells and the intensity per pixel. Shown are mean ± SD, n = 3. Exemplary images in (C). Merged image show nuclei in blue, F-actin in grey and the viral N protein in orange. Viral N is also shown in black as a separated image in the middle of the image panel.

