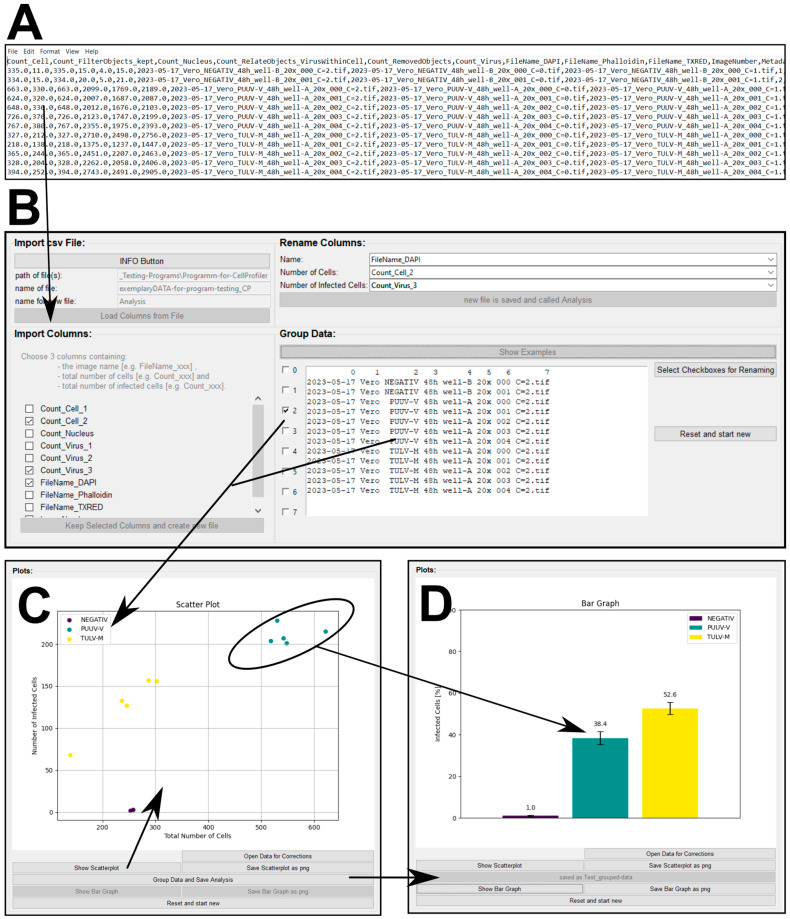
Figure 4.
Custom software tool for processing CellProfiler output. (A) An exemplary csv file as a result of using CellProfiler to quantify PUUV and/or TULV infection after 48 h. (B) Graphical user interface (GUI) of the software that allows for the processing of csv files. The software tool summarizes and groups’ important data columns based on the image name to obtain visual output in the form of scatterplots (C) or bar graphs (D).

