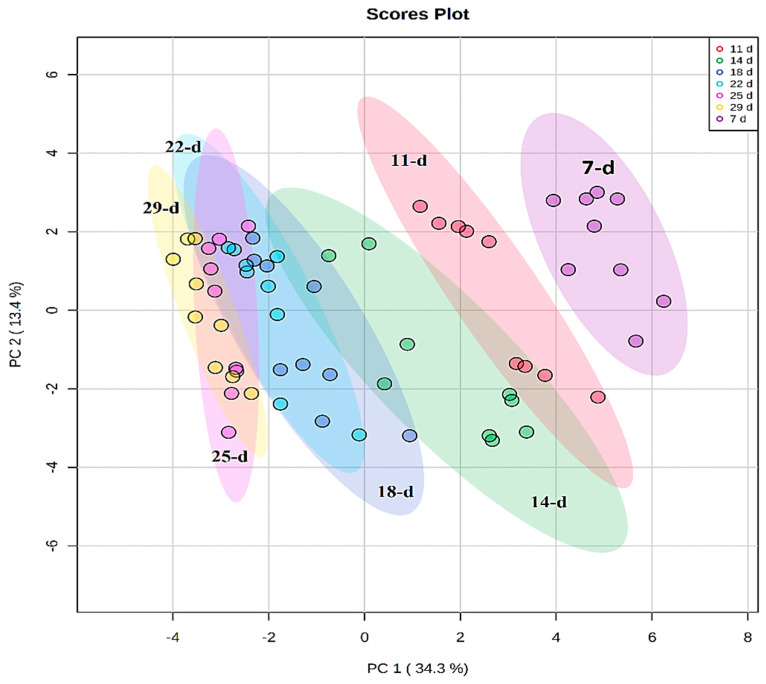
Figure 3.
Unsupervised chemometric analysis of annotated metabolites present in extracts from Sorghum bicolor seedlings at different developmental stages. Principal component analysis (PCA) plots were constructed using MetaboAnalyst: A scores scatter PCA plot (PC1 vs. PC2) of log-transformed and Pareto-scaled MS data from seedlings on days 11, 14, 18, 22, 25, and 29 post-germination. The clusters are colored based on the different developmental stages (purple = 7 d, red = 11 d, green = 14 d, blue = 18 d, turquoise = 22 d, pink = 25 d, and yellow = 29 d). The PC analysis generated 9 principal components, of which 64.9% of the total component variation was captured.

