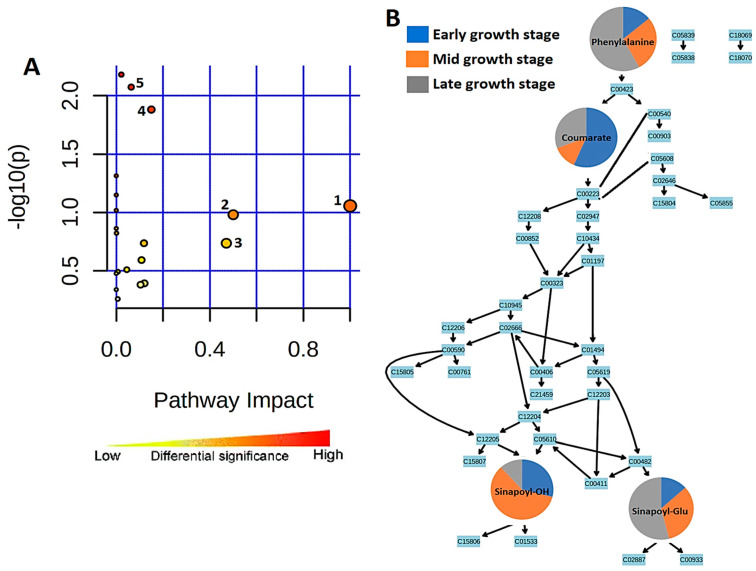
Figure 6.
Summarized representation of metabolic pathway analysis. (A) Pathways are arranged by increasing pathway impact, which represents differential significance, on the x-axis and by increasing p-value on the y-axis. Each pathway is represented by a circle in which size/radius increases with increasing impact, and the color of the circle also becomes more red as the p-value increases. 1, Biosynthesis of specialized metabolites. 2, Isoquinoline alkaloid biosynthesis. 3, Phenylalanine metabolism. 4, Flavone and flavonoid biosynthesis. 5, Phenylpropanoid biosynthesis. (B) A representation of the topological properties of the phenylpropanoid pathway. The changes in the four matched metabolites in their early, middle, and late seedling growth stages are represented by pie charts, indicating stage-specific quantitative variation.

