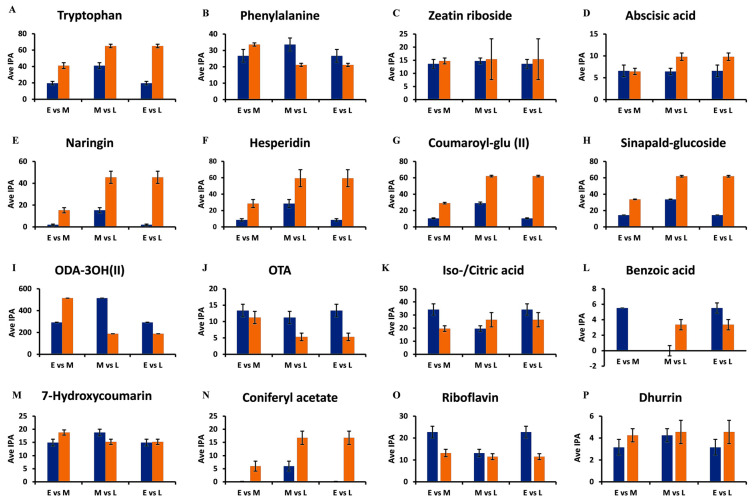
Figure 7.
Representative bar graphs showing the semi-quantification of discriminant metabolites retrieved from the OPLS-DA S plots. The average integrated peak area values (y-axis, Ave IPA, n = 9) of metabolites in the early (E = 7 d), middle (M = 14 d), and late (L = 29 d) growth stages are compared to illustrate developing trends within the metabolomes. In the paired comparisons, blue indicates the earlier time point (E or M), while orange indicates the later time point (M or L). (A,B) Tryptophan and phenylalanine of the amino acid class. (C,D) Zeatin riboside and abscisic acid of the hormone class. (E,F) Naringenin 7-O-neohesperidoside (naringin) and hesperidin of the flavonoid class. (G,H) Coumaroyl glucose and sinapylaldehyde glucoside of the HCA derivatives. (I,J) Trihydroxy-octadecadienoic acid and octadecatetraenoic acid of the lipid class. (K,L) Iso-/citric acid and benzoic acid of the organic acid class. (M,N) 7-Hydroxycoumarin and coniferyl acetate of the phenol class. (O) Riboflavin of the vitamin class and (P) Dhurrin of the cyanogenic acid class. The error bars indicate the standard deviation.

