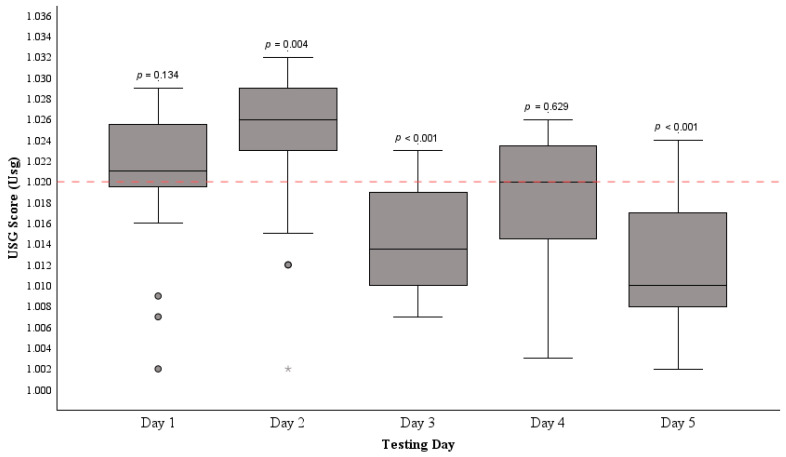
Figure 2.
The distribution of median USG scores among age-grade RU players (n = 28) before exercise across five separate testing days. The horizontal dashed line at 1.020 indicates the dehydration threshold. The mean USG over the five days significantly differed from the dehydration cut-off, as confirmed by a one-sample t-test (p = 0.011). Median USG was compared to the dehydration threshold each day with significance indicated by p-values. • represent IQR outliers and * represents an extreme IQR outlier.

