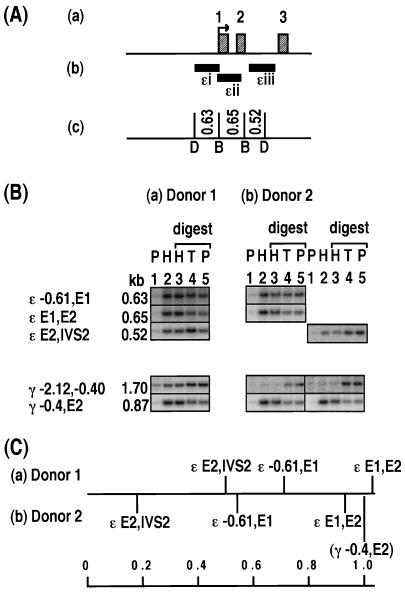
FIG. 2.
Relative levels of histone association of restriction enzyme sites in the ɛ-globin gene. (A) Maps of the ɛ-globin gene showing the locations of the transcription start site (arrow) and exons (labelled hatched boxes) (a), DNA probes (ɛi to ɛiii (b), and restriction enzyme sites (DraI [D] and BamHI [B]) and the lengths of DNA fragments (in kilobases) (c). (B) Southern blot analysis of HDNA and PDNA fractions for two sperm donors, donor 1 and donor 2. Lanes 1 and 2 contain PDNA (P) and HDNA (H). Lanes 3, 4, and 5 contain HDNA (H), total DNA (T), and PDNA (P) digested with BamHI (lanes 3) and DraI (lanes 5) restriction enzymes. Each lane contains 2 μg of DNA. The positions of the sites examined, on the border of each fragment, are marked as follows: E, exon; IVS, intron; negative values, distance upstream of the mRNA start site (in kilobases). Each column shows the same Southern blot probed with multiple DNA probes. The results for two γ-globin fragments, γ −2.12,−0.40 and γ −0.4,E2 are provided as negative and positive controls for enrichment in the HDNA fraction, respectively. The locations of these γ-globin fragments are illustrated in Fig. 3. The images were generated by using Molecular Dynamics ImageQuant and were compiled without alteration by using Microsoft Powerpoint and Adobe Photoshop. (C) Level of enrichment of a fragment in the HDNA fraction relative to that of the γ −0.4,E2 control fragment. For donor 1, the relative level of enrichment is displayed as an average for each fragment. The number of samples (in parentheses) and the values or the range of values are as follows: ɛ −0.61,E1 (2) 0.71 and 0.72; ɛ E1,E2, (2) 0.99 and 1.06; and ɛ E2,IVS2, (3) 0.41 to 0.66. For donor 2, the result of the sperm sample displayed in panel B is plotted. The other samples from donor 2 gave results similar to those presented, but the quantitation was less accurate as the signals were obtained using DNA probes labelled with digoxigenin-dUTP instead of [α-32P]dCTP, and the results were visualized on film rather than a phosphorimager screen. Figures 3 to 7 are set up like this figure and show different globin or protamine genes.

