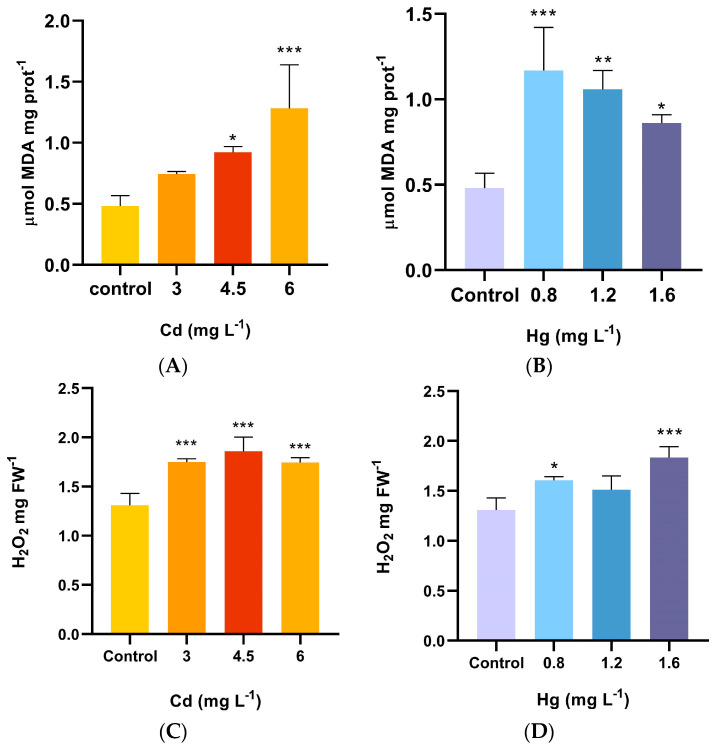
Figure 1.
Changes in the (A,B) MDA and (C,D) H2O2 contents of shoots of A. pinifolia after 60 days of Cd (3, 4.5, and 6 mg L−1) or Hg (0.8, 1.2, and 1.6 mg L1) treatment. All values are means ± SD (n = 3). Significant differences at *** p < 0.001, ** p < 0.01, and * p < 0.05 as compared to the control (Tukey’s post hoc test); ns: not significant.

