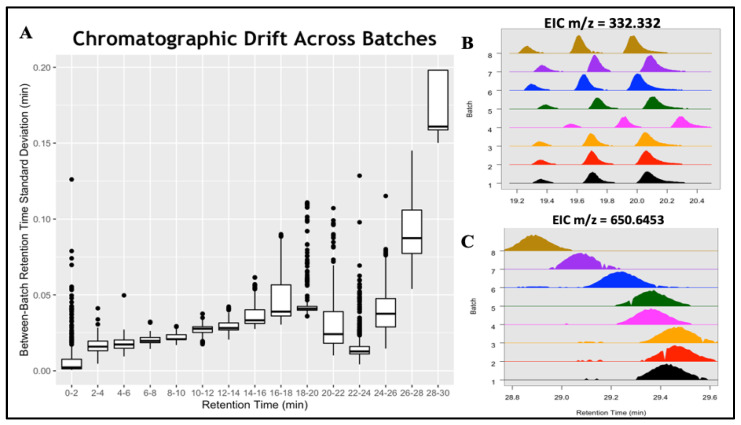
Figure 5.
Inter-batch RT drifts in the ELEMENT study. (A) Boxplot of reported batch RT standard deviations across discrete chromatographic regions. (B) EIC of three similar-mass (m/z = 332.332) compounds, with a random shift observed in batch 4. (C) RT drifting of one compound (m/z = 650.6453) from batch 1 (29.4 min) to batch 8 (28.9 min).

