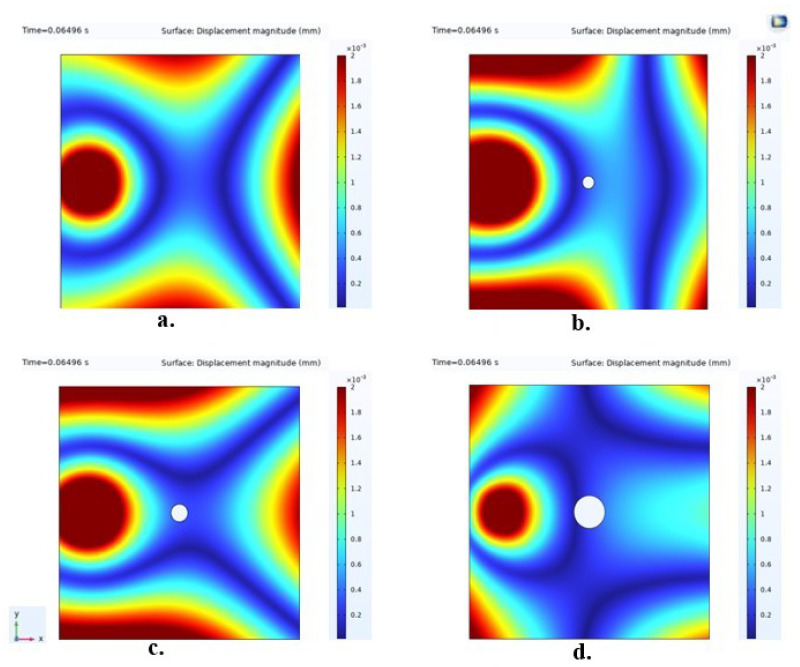
Figure 17.
The surface plots of the analyzed sample cases displaying the displacement magnitude for visualization of the disturbance created by damage on the Lamb waves. In these representations, (a) illustrates the healthy structure in its intact state, (b) shows a structure with 5 mm hole damage, (c) demonstrates a structure with 7 mm hole damage, and (d) displays a structure with 13 mm hole damage.

