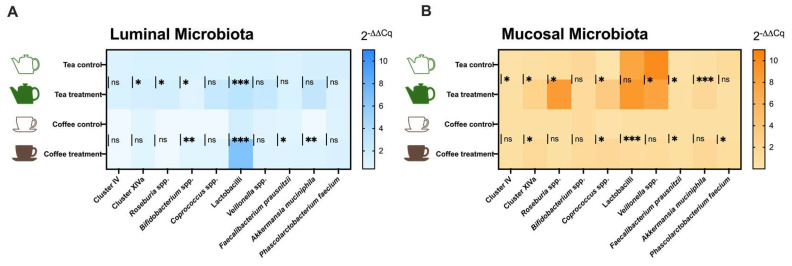
Figure 4.
Relative quantification (2−ΔΔCq) of target bacteria populations measured by qPCR in the (A) Luminal and (B) Mucosal ecosystems of the M-batches. Mean values (n = 6) are shown as heat maps, and significant differences when compared to control vs. treatment are presented as ns: no significant (p > 0.05), * (p ≤ 0.05), ** (p ≤ 0.01), *** (p ≤ 0.001). Statistical comparisons were conducted using the unpaired T-test or the Mann–Whitney test, depending on the normality of the data.

