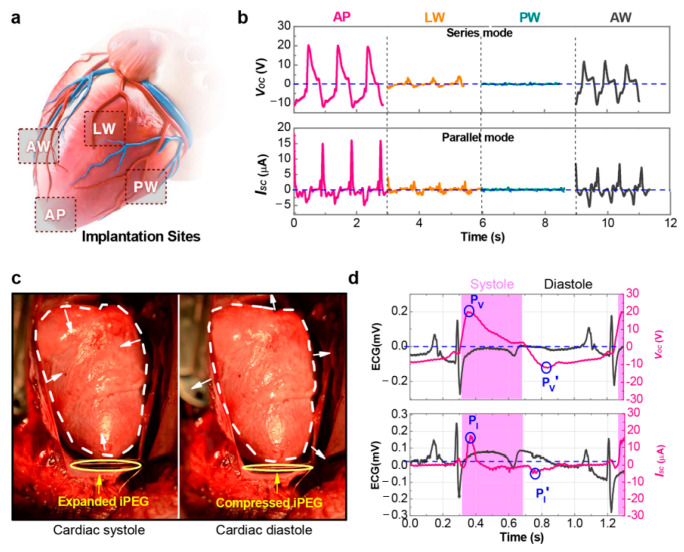
Figure 17.
In vivo evaluation for the performance of the iPEG. (a) Schematic view illustrating different implantation sites: apex (AP), anterior wall (AW), posterior wall (PW), and lateral wall (LW). (b) Voc of the implanted iPEG in series mode (upper) and Isc in parallel mode (lower) from different implantation sites. The output Voc and Isc reaches the peak values of 20 V and 15 μA, respectively, when the iPEG is fixed at AP. (c) Photographs of the iPEG in the pericardial sac fixed at AP, show that the iPEG expands during the cardiac systolic phase (left) and then is compressed by the heart during the cardiac diastolic phase (right). (d) Magnified and overlapped views of the ECG and the corresponding Voc (upper) and Isc (lower) waveforms of the iPEG at AP. Reprinted with permission from [151] Copyright 2023 American Chemical Society.

