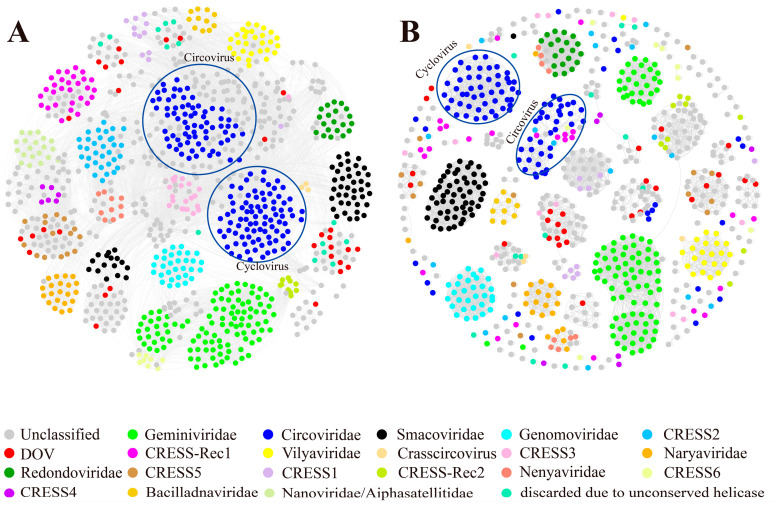
Figure 1.
Similarity clustering networks of oyster-associated CRESS DNA virus sequences. (A) Clustering network of 1012 Rep protein sequences. (B) Clustering network of 827 capsid protein sequences. The networks were visualized using the Fruchterman–Reingold algorithm in Gephi (version 0.9.2). Dots represent different proteins. Edges indicate that the DIAMOND BLASTP scores ≥ 150 (A) and ≥42.7 (B) between the connected dots.

