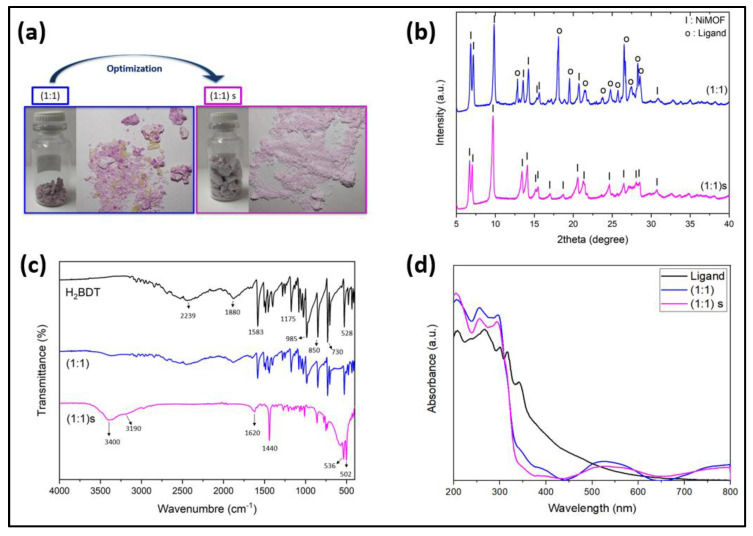
Figure 3.
(a) Optical images of the NiMOF synthesized at ratios (1:1) and with stirring (1:1)s; (b) powder X-ray diffractogram of the NiMOFs (CCDC 826920) samples (1:1) and (1:1)s; (c) FT-IR spectrum for the samples (1:1), (1:1)s, and ligand; (d) UV–visible absorption spectrum for the samples (1:1) and (1:1)s compared with the ligand.

