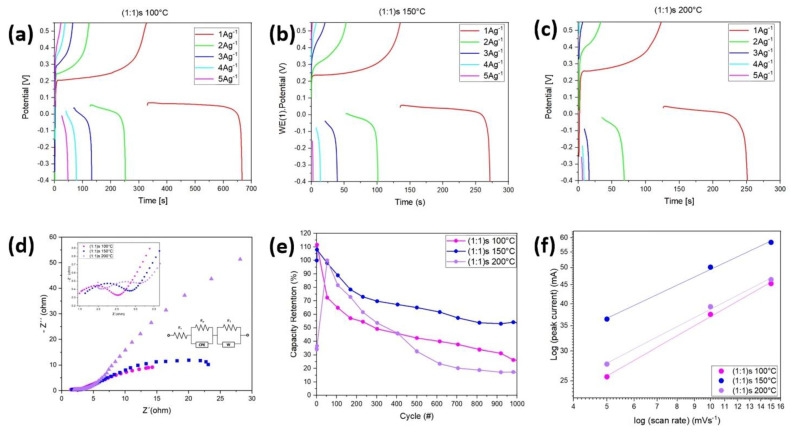
Figure 8.
The galvanostatic charge and discharge performances at different currents for the samples (a) (1:1)s 100 °C; (b) (1:1)s 150 °C; and (c) (1:1)s 200 °C. (d) Nyquist plot of the three samples in the range of 0.1 MHz 0.1 Hz and the Randles circuit; (e) capacity retention up to 1000 cycles; and (f) relationship between log (peak current) and log (scan rate) in the cathodic regions of the samples.

