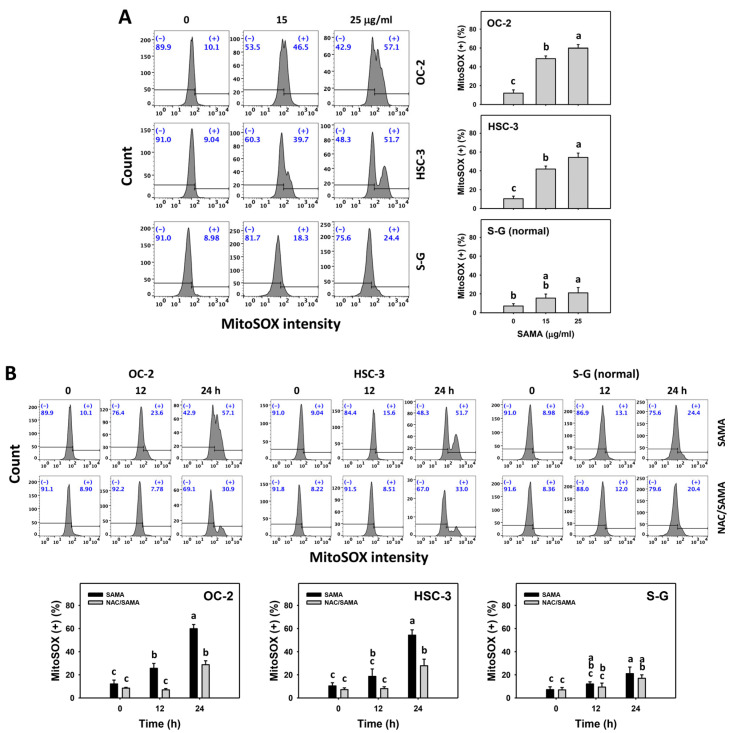
Figure 7.
SAMA shows MitoSOX upregulation in oral cancer cells. (A) MitoSOX assay for SAMA. Cells were treated with 0.1% DMSO (untreated control) and SAMA (0, 15, and 25 μg/mL) for 24 h. (+) is assigned to the MitoSOX (+) (%) region. (B) MitoSOX assay for NAC/SAMA. NAC/SAMA represents the pre-treatment of 10 mM NAC for 1 h and the post-treatment of 25 μg/mL SAMA for 0, 12, and 24 h. Data are shown as means ± SD (triplicate). An absence of overlapping annotations (lowercase notes) between treatments indicated a significant difference (p < 0.05).

