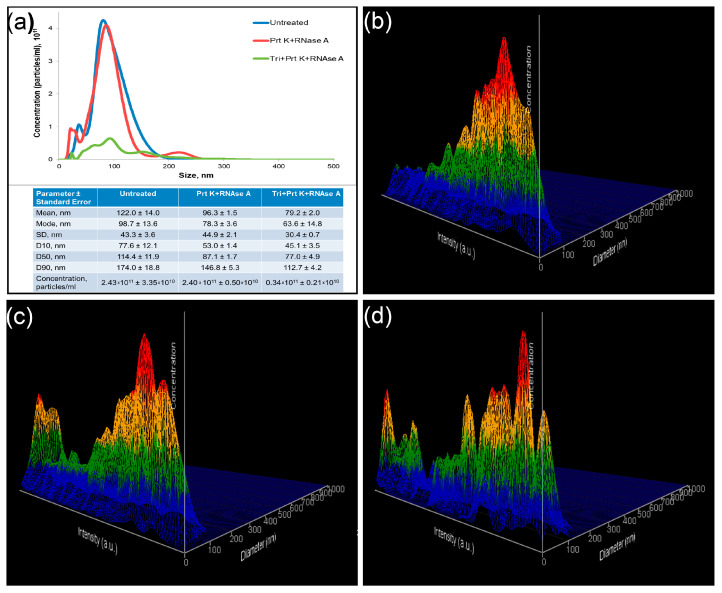
Figure 5.
Nanoparticle tracking analysis of treated and untreated samples. (a) Comparative analysis of representative measurements of untreated (blue), treated with Proteinase K and RNAse A (red), and treated with Triton X 100, Proteinase K, and RNAse A (green) samples. Representative 3D graph of size distribution (size vs. intensity vs. concentration) of untreated (b), treated with Proteinase K and RNAse A (c), and treated with Triton X 100, Proteinase K, and RNAse A (d) samples.

