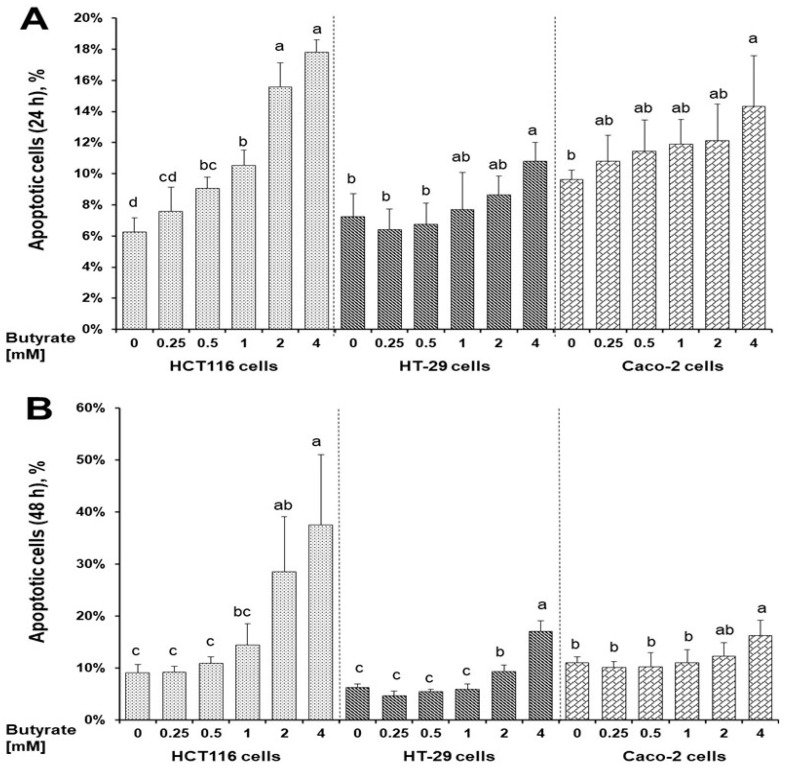
Figure 2.
Distinct effects of butyrate on apoptosis in HCT116, HT-29, and Caco-2 cells for (A) 24 h, (B) 48 h. Data are presented as means ± SDs for each group within each cell line at 24 and 48 h (n = 4). Means that do not share the same letters within a cell line are significantly different using Tukey’s HSD following one-way ANOVA, p < 0.05.

