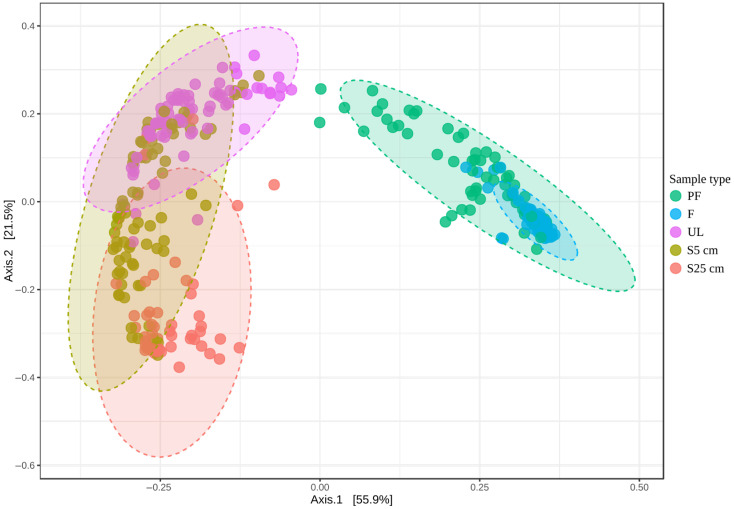
Figure 2.
Analysis of differences in community structures between different sample types (beta diversity analysis). The visualization was based on counting the difference in the representation of microbial genera based on Jensen–Shannon Divergence and Principal Correspondence Analysis (PCoA) ordination. The significance of differences between microbial communities of different sample types based on the genus taxonomic level was assessed by PERMANOVA: F-value = 189.34; R2 = 0.67661; p-value = 0.001.

