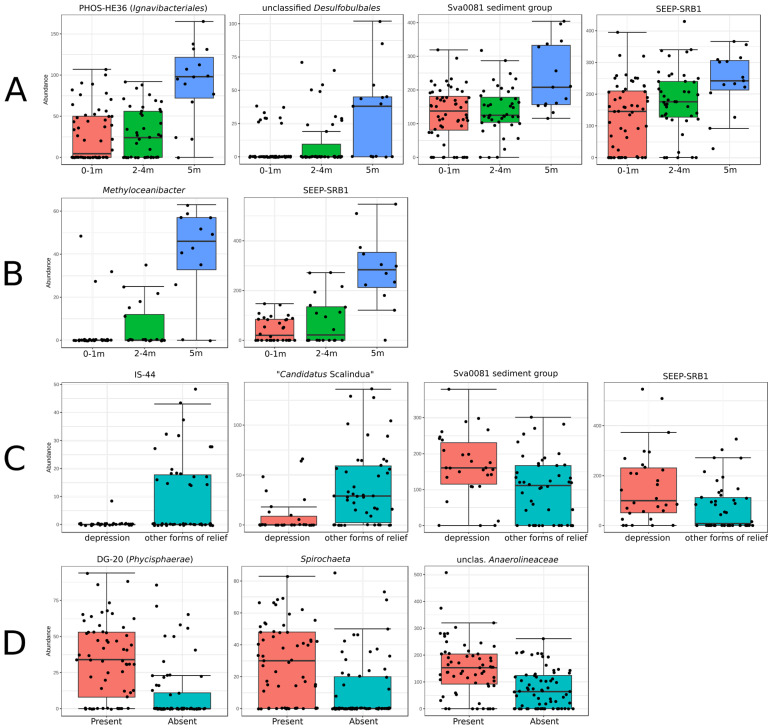
Figure 5.
Distribution of ASV abundance of different groups in the normalized data of (A) the sediment samples (S25 cm and S5 cm) depending on the thickness of the marine sediment complex, (B) the UL samples depending on the thickness of the marine sediment complex, (C) the UL samples depending on the bottom morphology, and (D) the sediments samples (S25 cm and S5 cm) depending on the presence of hydrotroilite interlayers. Group names are given according to SILVA SSU 138.1 (Quast et al., 2013 [31]).

