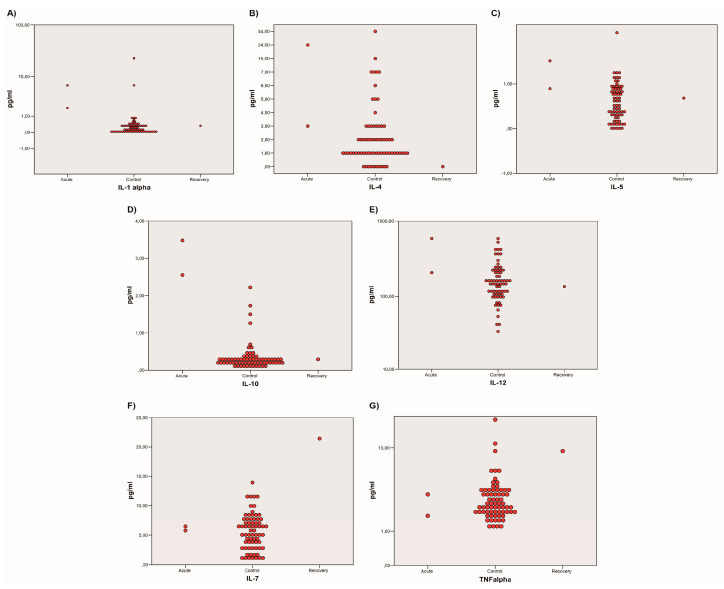
Figure 4.
Two-dimensional dot-plot graphs comparing healthy controls to acute-phase or recovery-phase cases. Images (A–E) show that the acute-phase patients (on the left) presented higher concentrations of IL-1α, IL-4, IL-5, IL-10, and IL-12, respectively, while the recovery patient (on the right) can be assimilated to the healthy controls (in the middle). Images (F,G) represent TNF-α, and IL-7 that presented higher values in the convalescent patient (on the right) compared to the healthy controls (in the middle) and the acute-phase patients (on the right). All cytokines are expressed in pg/mL.

