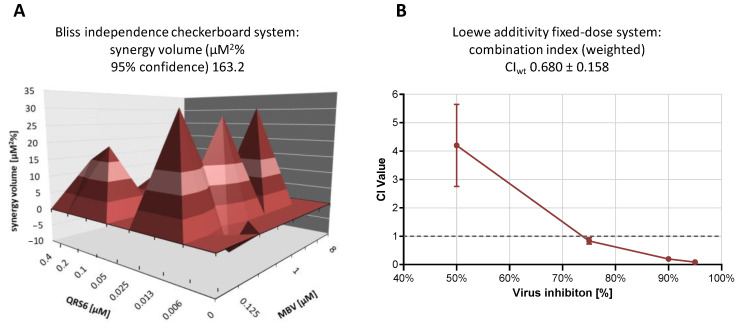
Figure 6.
Synergistic anti-HCMV activity demonstrated for the combination treatment QRS6 + MBV. (A) Results of the Bliss independence checkerboard assay represented as a synergy plot at 95% confidence interval. Inhibition of HCMV replication by the single compounds at the indicated concentrations was determined, and a theoretical additive inhibition was calculated for each combination of concentrations. Depicted in the planar diagram is the deviation of observed inhibitory effects from this calculated additive value in percentage points, as calculated at a confidence interval of 95% based on three biological replicates. Note that negative synergy volumes (below the 0 µM2% plane) indicate antagonistic interaction, and positive volumes (above the 0 µM2% plane) indicate synergistic interaction [45]. (B) Results of the Loewe additivity fixed-dose assay. Dose–effect curves for each drug were converted to median effect plots before the combination index (CI) values for the drug combinations were extrapolated at 50% (CI50), 75% (CI75), 90% (CI90), and 95% (CI95) virus inhibition. Note that the weighted CI of the virus inhibition (CIwt) for this combination was 0.680 ± 0.158, which implied a moderate level of synergistic interaction. GFP-based fluorometry was measured in quadruplicate, and mean values ± SD are given.

