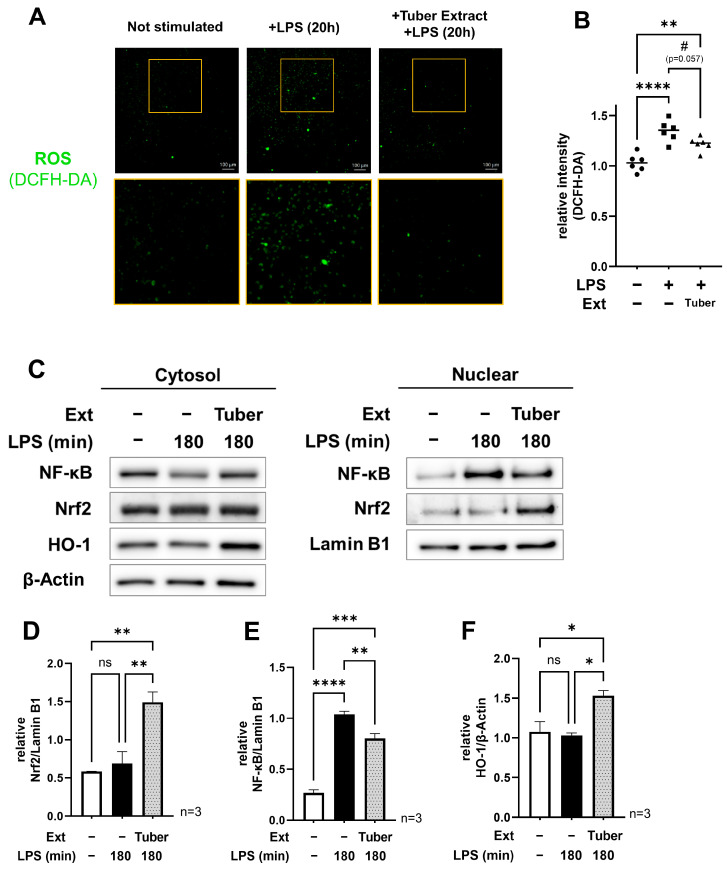
Figure 2.
Analysis of intracellular ROS, NF-κB, and Nrf2 oxidative stress response pathway under tuber extract conditions: (A,B) Fluorescence microscopy images of intracellular ROS at 20 h after LPS stimulation with/without tuber extracts and comparison of its fluorescence intensity per cell; (C) Western blot of nuclear and cytoplasmic fractions at 180 min after LPS stimulation in the presence of tuber extracts; (D–F) Relative quantification of nuclear NF-κB, Nrf2, and cytoplasmic HO-1: mean ± SEM, one-way ANOVA with Tukey’s post-hoc test, #: p < 0.1, *: p < 0.05, **: p < 0.01, ***: p < 0.001, ****: p < 0.0001, ns: not significant : LPS, lipopolysaccharide; Ext, extract; ROS, reactive oxygen species.

