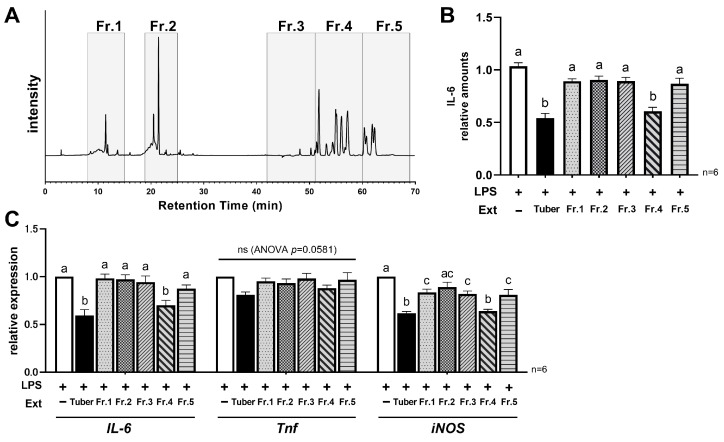
Figure 4.
Characterization of the components responsible for anti-inflammatory activity in tuber extracts: (A) Peaks observed in HPLC analysis of tuber extracts and fraction settings; (B) Relative production level of IL-6 at 24 h after LPS stimulation with/without tuber extracts or each fraction; (C) Relative expression of pro-inflammatory genes (IL-6, Tnf, iNOS(Nos2)) at 24 h after LPS stimulation with/without tuber extracts or each fraction: (B,C) mean ± SEM, one-way ANOVA with Tukey’s post-hoc test, Distinct symbols (a, b, c) are used to denote significant differences between groups: LPS, lipopolysaccharide; Ext, extract; Fr., fraction.

