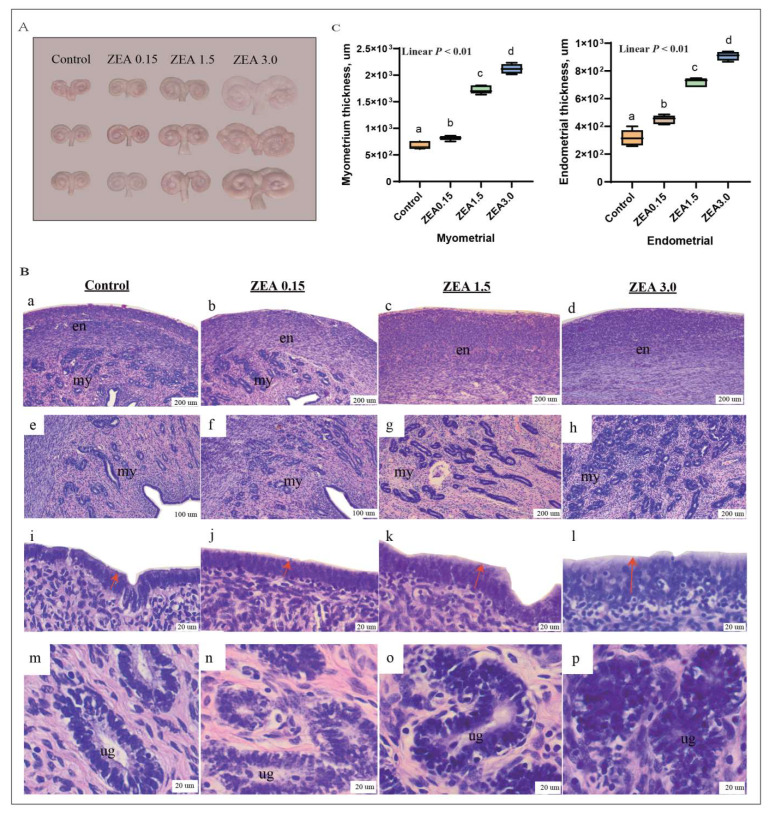
Figure 1.
Effects of ZEA on uterine hypertrophy (A), histological structure of the uterus (B), myometrial and endometrial thickness (C) in gilts. The “en”, “my”, and “ug” in (B) represent the endometrium, myometrium, and uterine gland, respectively. Control, ZEA0.15, ZEA1.5, and ZEA3.0 represent the control diet with an addition of 0, 0.15, 1.5, and 3.0 mg·kg−1 ZEA. In (B), a, e, i and m are the observation results of the Control group’s uterine myometrium and endometrium at different multiples; b, f, j and n are the observation results of the ZEA0.15 group’s uterine myometrium and endometrium at different multiples; c, g, k and o are the observation results of the ZEA1.5 group’s uterine myometrium and endometrium at different multiples; d, h, l and p are the observation results of the ZEA3.0 group’s uterine myometrium and endometrium at different multiples. In (C), values with different letter superscripts mean significant difference (p < 0.05), while with same letter superscripts mean no significant difference (p > 0.05).

