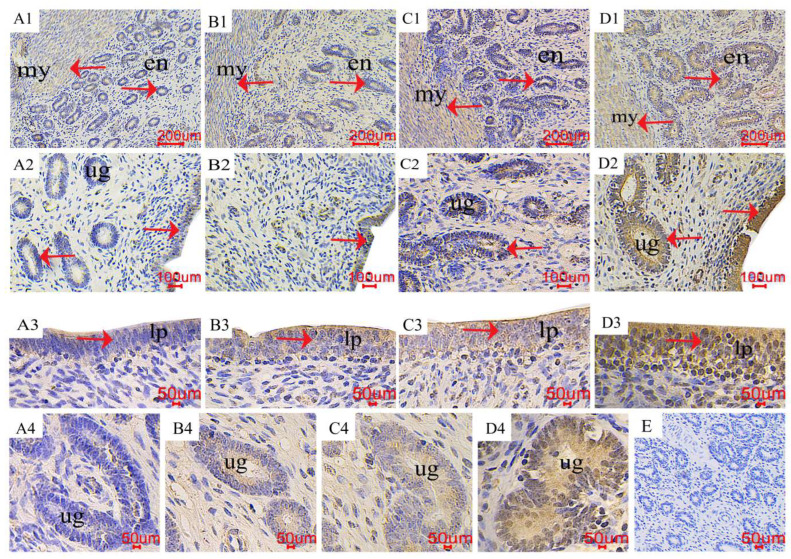
Figure 6.
Effects of ZEA on the Beclin1 localization of the uterus in gilts. The “en”, “my”, “lp”, and “ug” represent the endometrium, myometrium, lamina propria, and uterine gland, respectively. (A–D) represent the control diet with an addition of 0, 0.15, 1.5, and 3.0 mg·kg−1 ZEA. (E) was the negative control.

