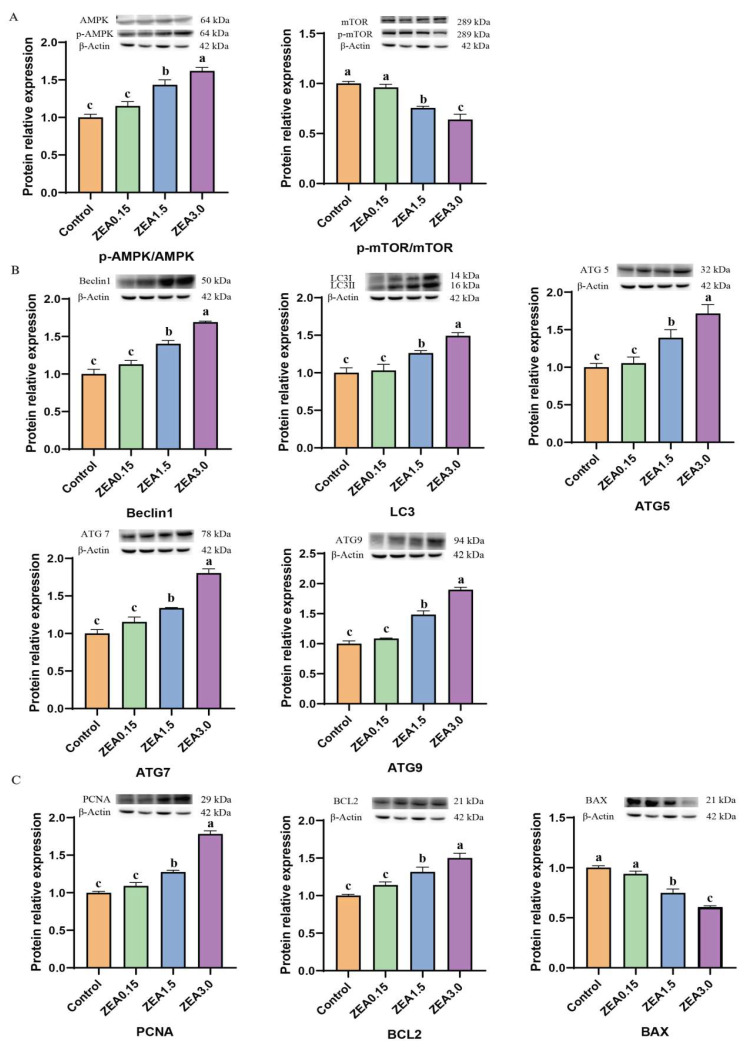
Figure 9.
Effect of ZEA on the relative protein expression of (A) p-AMPK/AMPK and p-mTOR/mTOR, (B) autophagy, and (C) proliferation apoptosis-related genes. Control, ZEA0.15, ZEA1.5, and ZEA3.0 represent the control diet with an addition of 0, 0.15, 1.5, and 3.0 mg·kg−1 ZEA. Values with different letter superscripts mean significant difference (p < 0.05), while with same letter superscripts mean no significant difference (p > 0.05).

