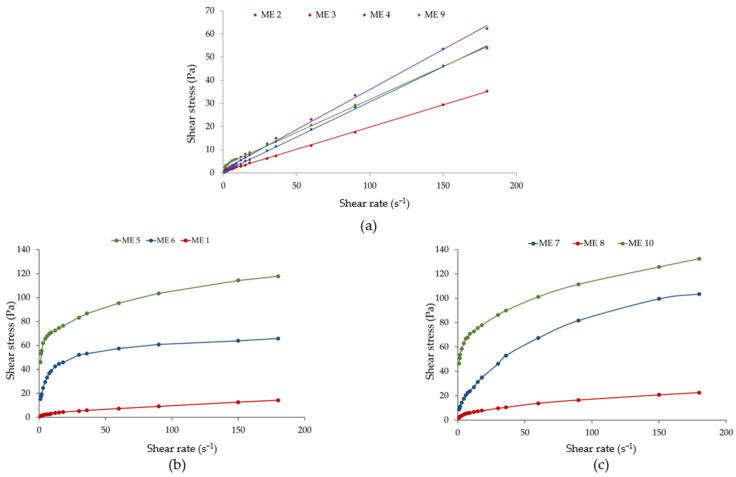
Figure 4.
Plots of shear stress (Pa) as a function of shear rate (s−1) following specific rheological models: linear profiles for ME 2–ME 4 systems described by the Newton’s model, and ME 9 described by Bingham model—case (a); flow curves fitted by the Ostwald–de Waele model for ME 1 and ME 8 systems, and Herschel–Bulkley model specific for ME 5–ME 7 and ME 10 gel-like systems—cases (b,c).

