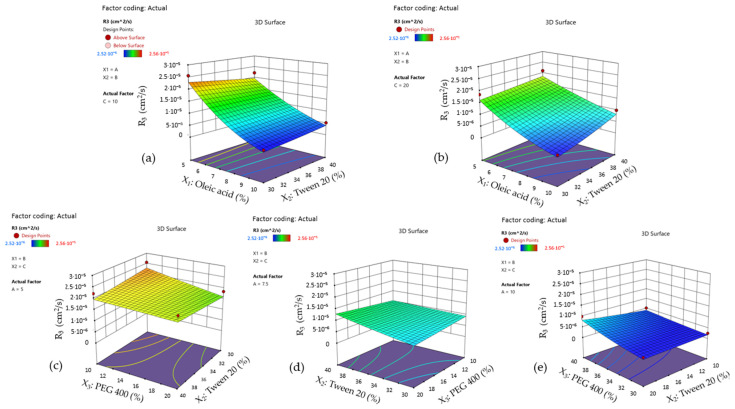
Figure 18.
Surface plots for diffusion coefficient (Y3) as a function of X1: Oleic acid (%), X2: Tween 20 (%) terms, by fixing PEG 400 concentration at 10%—case (a), 20%—case (b); and as a function of X2: Tween 20 (%), X3: PEG 400 (%), by fixing oleic acid concentration at 5%—case (c), 7.5%—case (d), and 10%—case (e).

