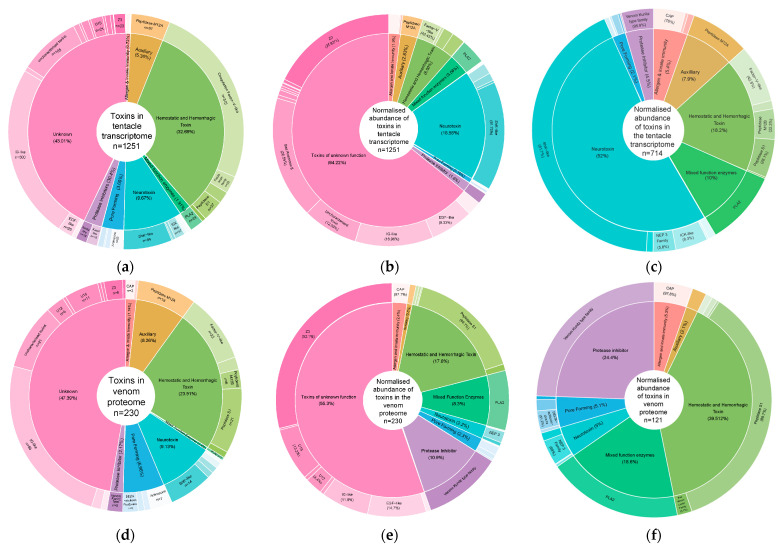
Figure 2.
Pie donuts visualising venom function category (% = percentage of venom composition) (inner circle) and toxin protein family (n = number of gene clusters in each family) (outer circle) for (a) gene clusters from tentacle transcripts, (b) normalised abundance from tentacle transcripts, (c) normalised abundance from tentacle transcripts without toxins of unknown function category, (d) gene clusters from venom proteins, (e) normalised abundance from venom proteins, (f) normalised abundance from venom proteins without toxins of unknown function category.

