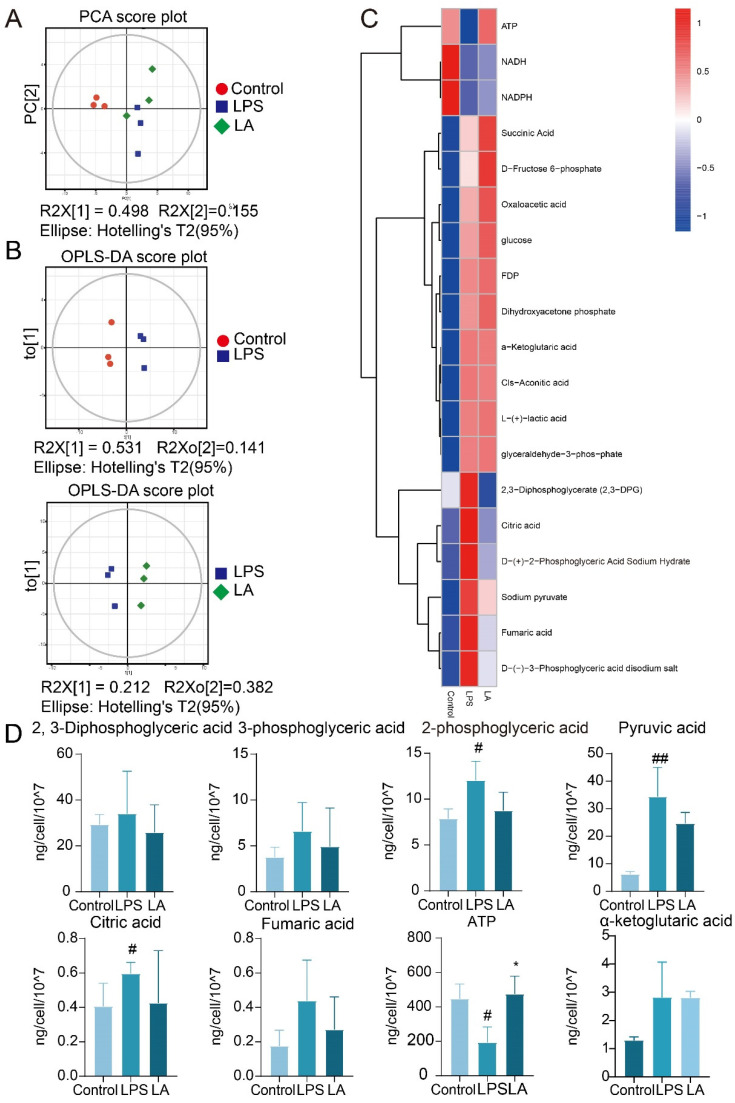
Figure 5.
Central carbon target metabolome analysis. (A) PCA scatter plot of total sample of con group, LPS group and LA group; (B) OPLS-DA model scatter plot of CON group vs. LPS group and LPS group vs. LA group; (C) Hierarchical cluster analysis thermodynamic diagram; (D) Histogram of differential metabolites vs. CON, ## p < 0.01, # p < 0.05; vs. LPS, * p < 0.05. Data are presented as the mean ± SD. LA: Levistilide A, LPS: lipopolysaccharide.

