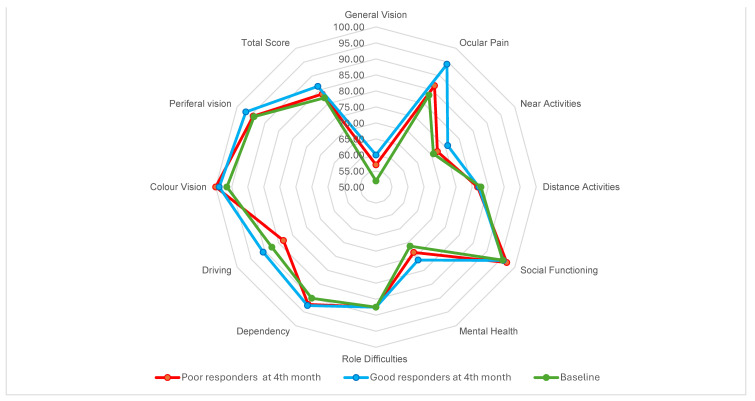
Figure 1.
Star graph showing median NEI-VFQ 25 values from baseline to 4th month, comparing early responders to early poor responders. After the loading phase, we found that good responders presented higher average scores in several subfields. In ocular pain, good responders achieved a mean score of 94.75 (87.5–100), whereas poor responders achieved 87.5 (75–100). In near-distance activities, good responders averaged 75.85 (62.50–91.60) and poor responders 67 (54.17–89.55). In mental health good responders present a higher score 77.25 (67.19–81.25), and poor responders 75 (62.50–84.38). However, none of the differences were significant.

