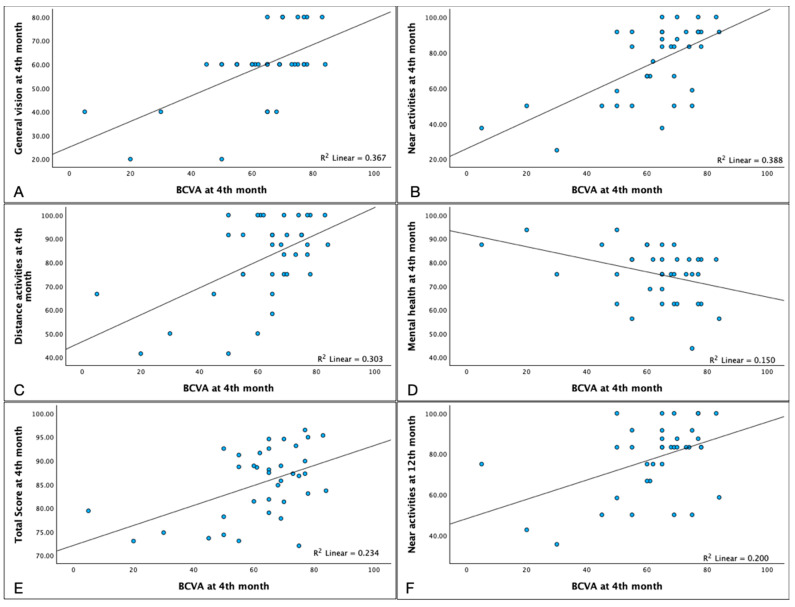
Figure 4.
Relationship of Best Corrected Visual Acuity (BCVA) and NEI-VFQ 25 subscales at 4th month. In our series, the BCVA at baseline was positively correlated with NEI-VFQ 25 scores in the subfields of: General Vision ((A) Spearman’s ρ = 0.557 p = <0.001), Near Activities ((B) ρ = 0.540 p = 0.001), Distance Activities ((C) ρ = 0.378 p = 0.021) and Total Score ((E) ρ = 0.392 p = 0.016). BCVA at the 4th month was negatively correlated with Mental Health ((D) ρ = −0.367 p = 0.026). BCVA correlated with the Near Activities score at 12th month ((F) ρ = 0.419 p = 0.001).

