Fig. 5.
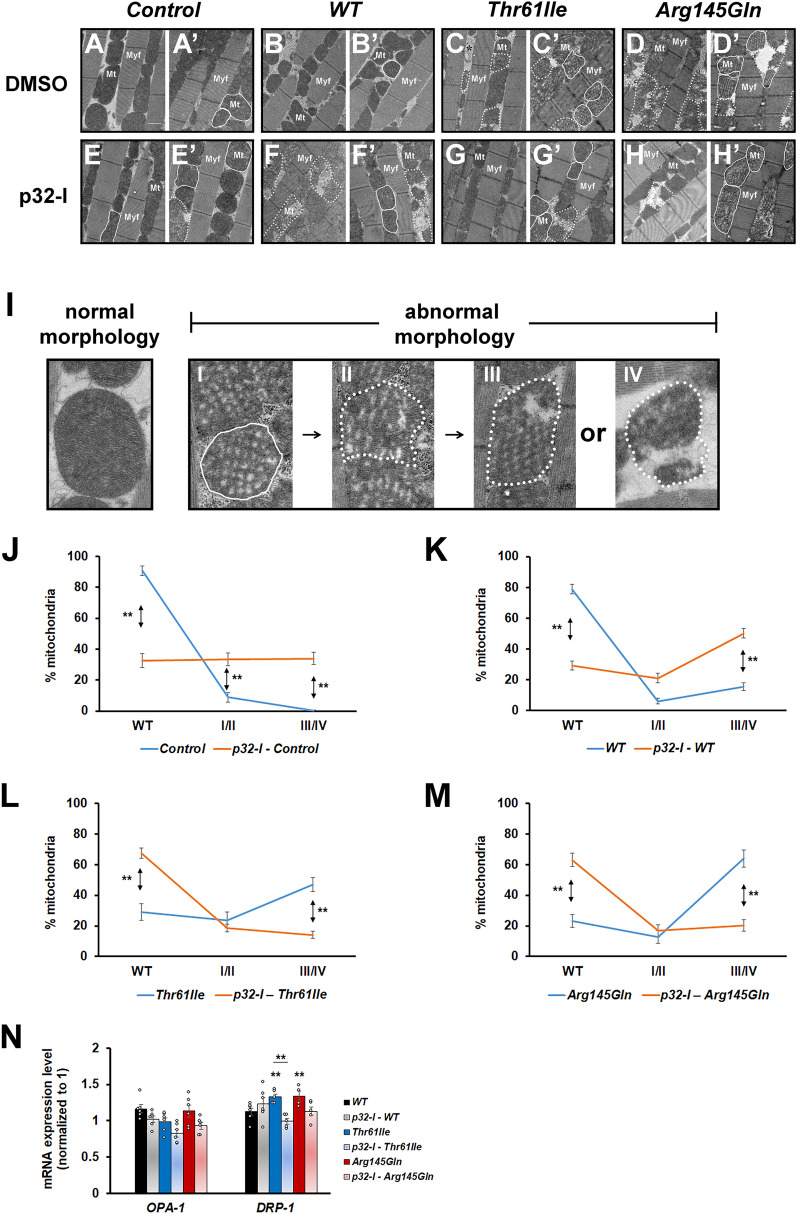
p32-inhibitor treatment ameliorates the muscle mitochondria morphological defects of mutant hCHCHD2 expressing Drosophila. A–H’ Representative Transmission Electron Microscopy (TEM) images of the indirect flight muscles of the 45-day-old Drosophila expressing the indicated transgenes and which have been fed with either DMSO or 25 µM of p32-I. Control is of genotype 24B-GAL4/ + . Two images for each category are shown for clarity. Myf: myofibril, Mt: mitochondria. Solid lines encircle mitochondria with spongy appearance and dotted lines encircle fragmented mitochondria. I The different categories of mitochondria are shown. Normal mitochondria appear densely packed and tubular while abnormal mitochondria appear less densely packed with spongy appearance (I, II) and fragmented (III, IV). J–M Quantification of the mitochondrial morphology. Graph plots showing the percentages of the different categories of mitochondria (normal/WT, I/II and III/IV). For each group, a total of 293 to 969 mitochondria were scored (n = 3). Statistics used is two-tailed Paired Samples t-test. N qRT-PCR analysis of OPA-1 (n = 6 for all groups) and DRP-1 expressions (n = 4 for Arg145Gln group; n = 5 for Thr61Ile, p32-I – Thr61Ile, p32-I – Arg145Gln groups; n = 6 for WT, p32-I – WT groups). Statistics used is One-way ANOVA with Bonferroni post hoc test. n = experimental repeats. Data are presented as mean ± SEM. *p < 0.05; **p < 0.01

