Fig. 8.
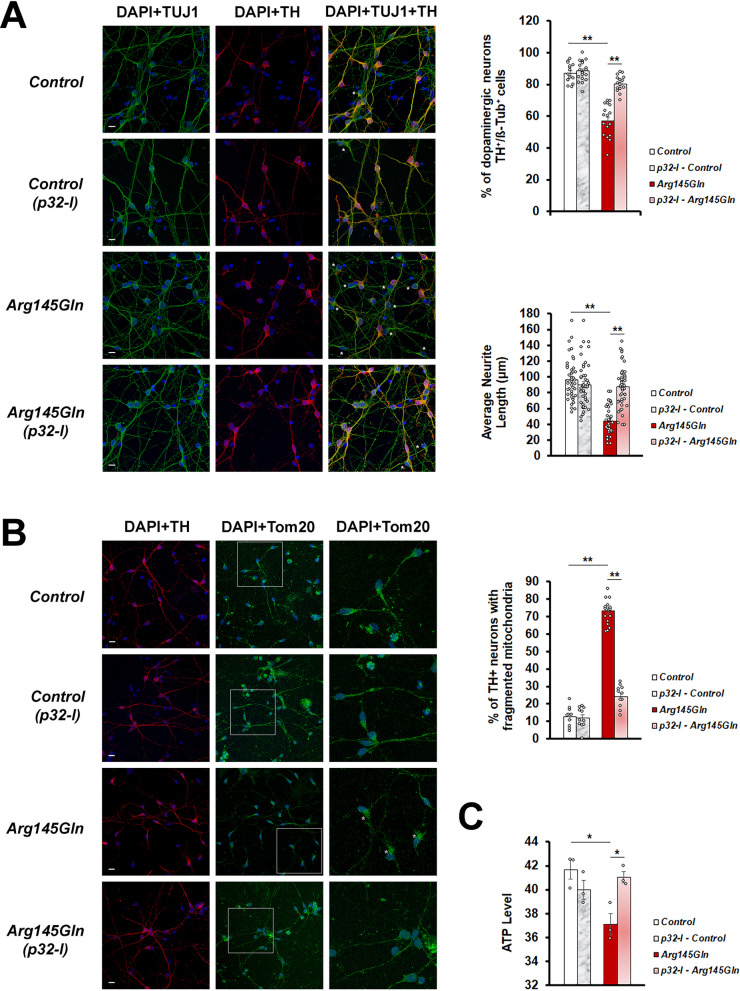
p32-inhibitor rescues dopaminergic fate, neurite length, mitochondrial morphology and function of CHCHD2-Arg145Gln neurons. A Representative confocal images of immunoreactivity for the dopaminergic neuronal marker (TH; red), the pan-neuronal marker (TUJ1; green) and the nuclei marker (DAPI; blue). Scale bar = 10 µm. Quantitation of TH expressing neurons (n = 3, each involving at least 100 neurons). Comparison of neurite length of CHCHD2-Arg145Gln neurons versus the Control neurons, in the absence or presence of p32-I. B Representative confocal images of immunoreactivity for the dopaminergic neuronal marker (TH; red), the mitochondrial marker (TOM20; green) and the nuclei marker (DAPI; blue). Dopaminergic neurons with normal mitochondria have tubular TOM20 staining in the neuronal cell bodies and their projections and those with abnormal mitochondria have fragmented mitochondria in the cell bodies and absence of or reduced TOM20 staining in the axonal projection. Magnified regions are boxed. Scale bar = 10 µm. Quantitation of the mitochondrial morphology (n = 3, each repeat involving at least 100 mitochondria). C Measurement of ATP levels in the CHCHD2-Arg145Gln neurons as compared to the Control neurons, in the absence or presence of p32-I (n = 3). In all graphs, statistics used is One-way ANOVA with Bonferroni post hoc test. n = experimental repeats. Data are presented as mean ± SEM. *p < 0.05; **p < 0.01

