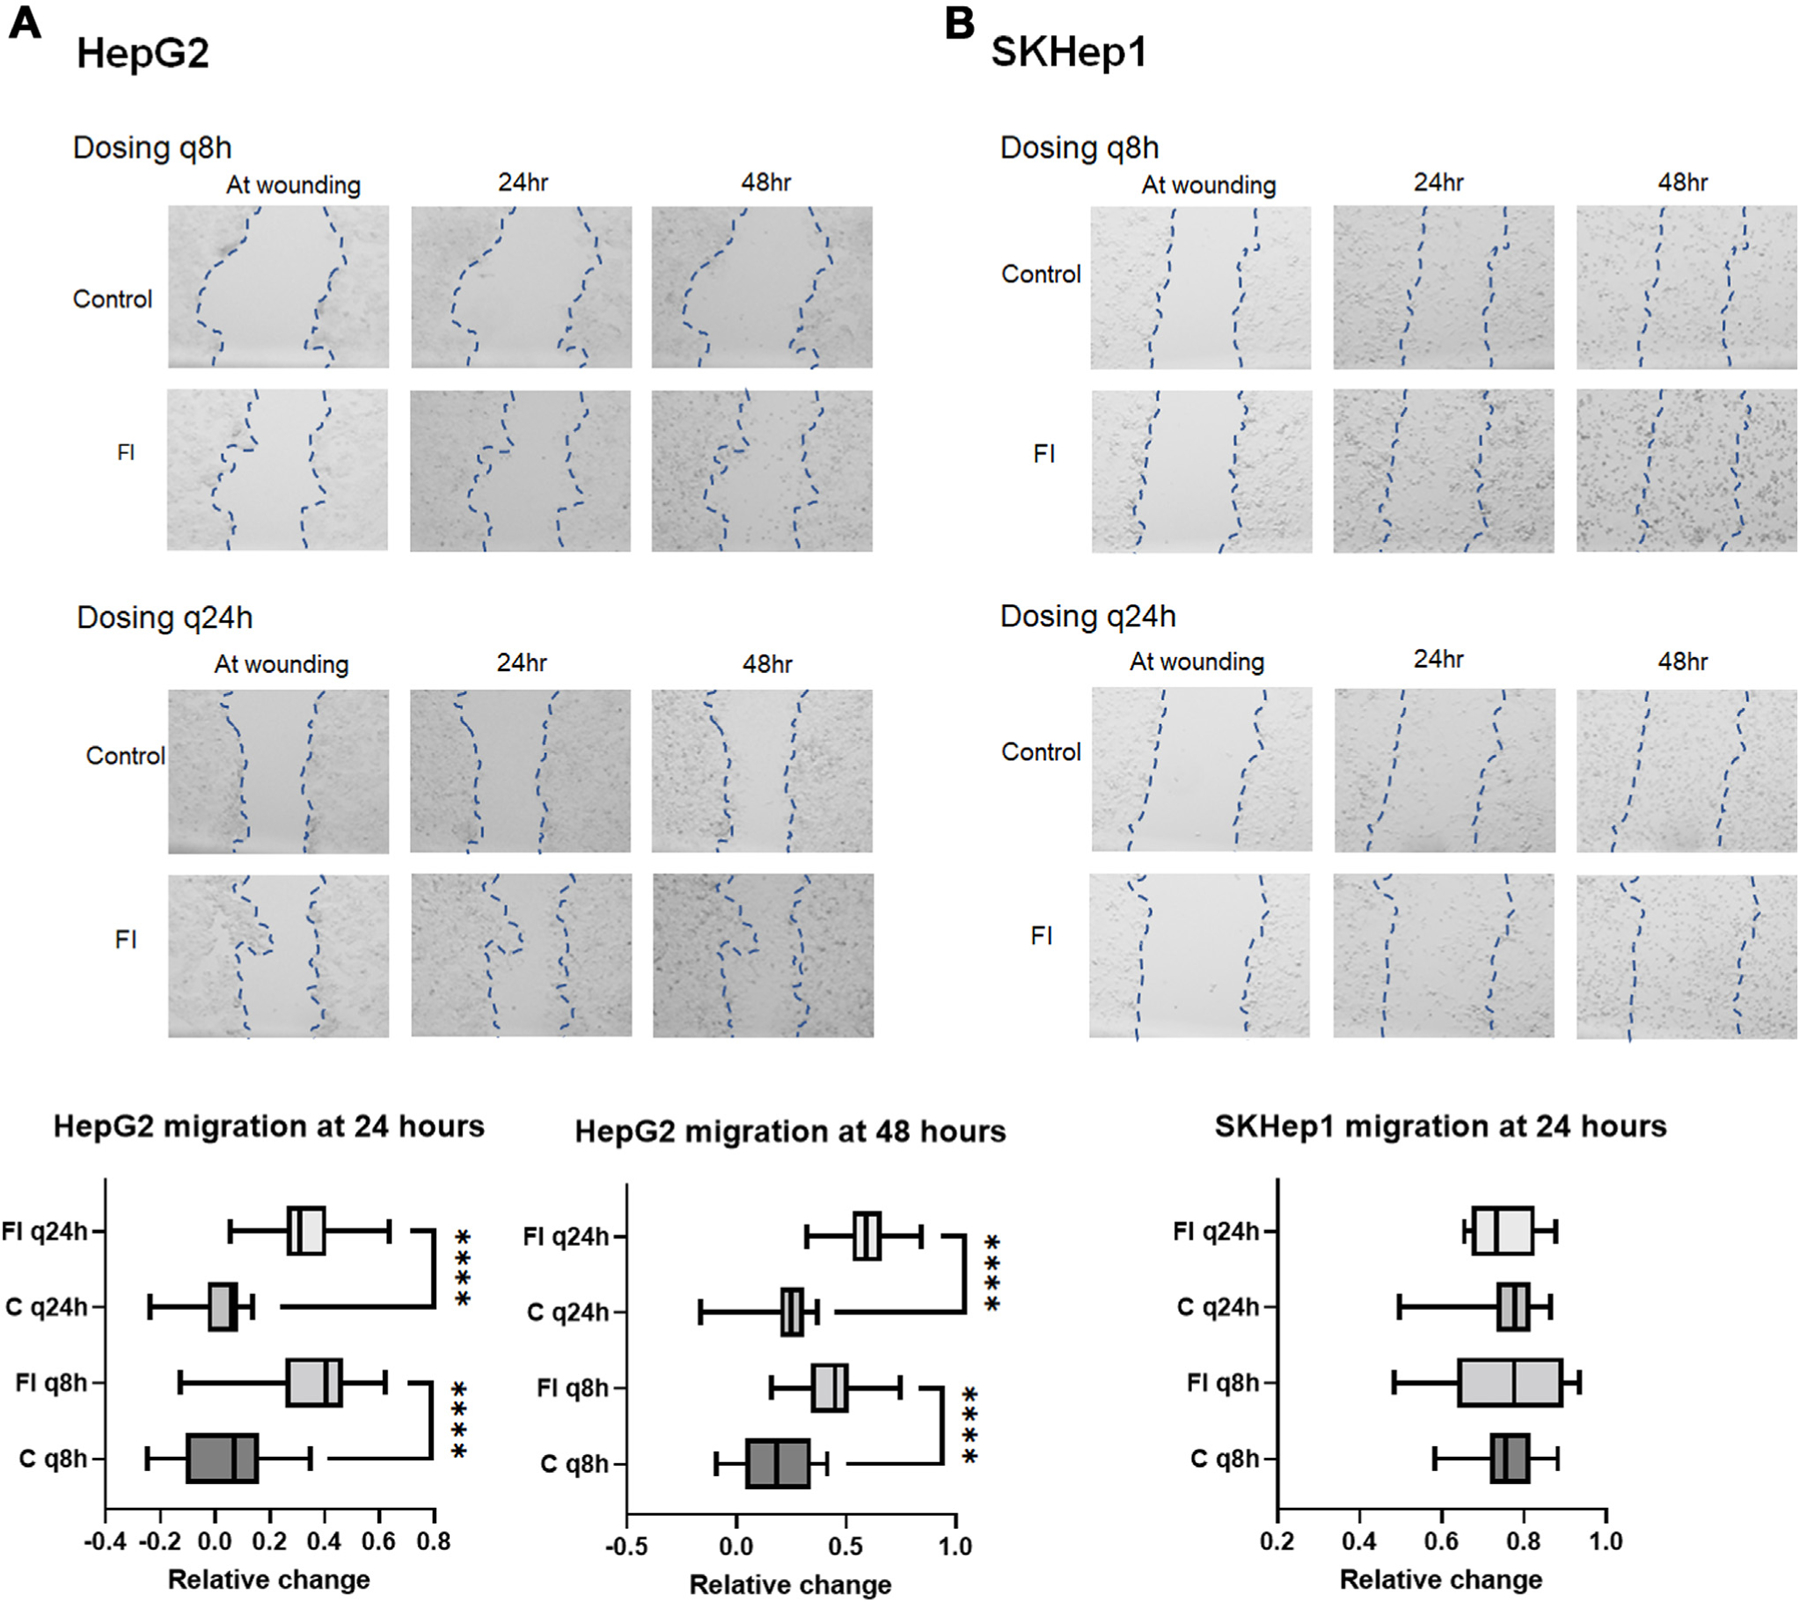
Fig. 5 –

FI increases HepG2 migration. (A) Migration of cells was minimal in control HepG2 cells. With q8h FI, migration is increased with some variability compared to the control, but with q24h treatment, migration was greatly increased following multiple doses of FI as shown in the bar graphs for 24 h and 48 h of treatment. (B) SKHep1 cells show no difference in migration compared to control for either treatment arm, but cell morphology/floating cells in q8h arm suggests significant cell death. (4x images zoomed 6.5x to visualize wound area-EVOS XL). Graphs for each experiment depict the average difference of individual measurements from replicate experiments across time points by measuring wound width at multiple points.
