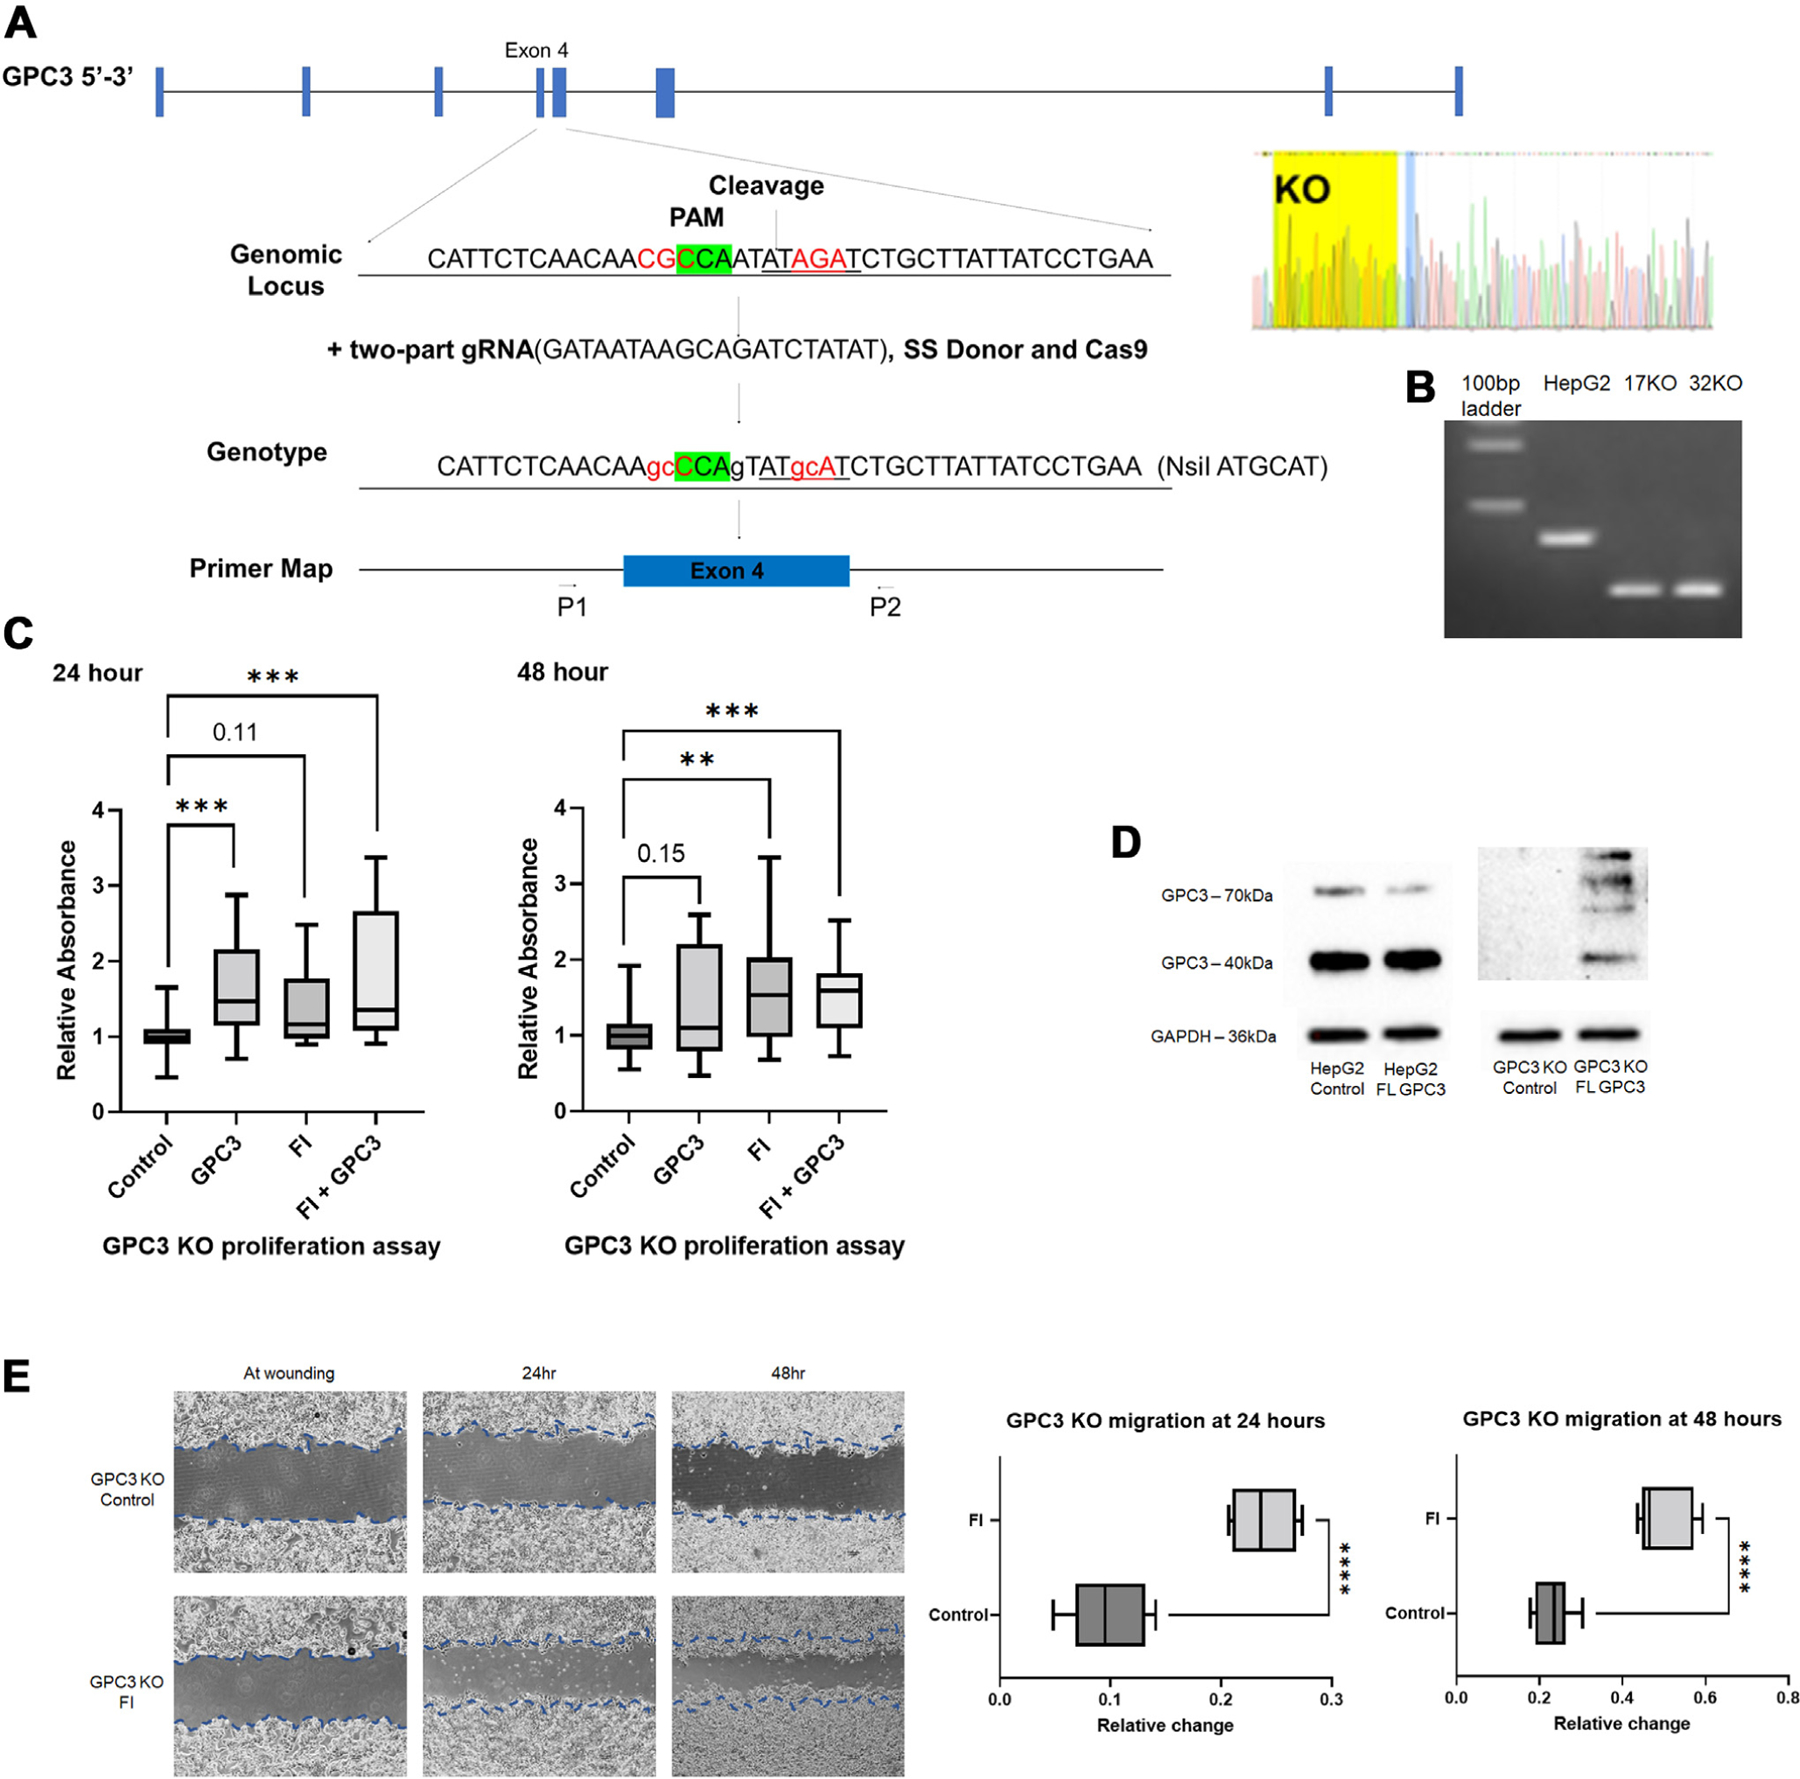
Fig. 6 –

GPC3 peptide increases proliferation in GPC3 knock out (KO) HepG2 cells with no effect after treatment with FI. (A) Design of HepG2 Crispr GPC3 KO cell lines with PAM, restriction site, and sequencing confirmation. (B) PCR genotyping confirming no expression of GPC3 in knock out cell line. Compared to HepG2 (~345 bp), KO yields truncated PCR band (~220 bp). A portion of the 100 bp ladder is shown in lane one. (C) GPC3 KO cells were treated with FI, FL GPC3 peptide and combination of FI and FL GPC3 peptide for 24 and 48 h. At 24 and 48 h, there was increase in proliferation following treatment with full-length GPC3 peptide, FI, and combination of full-length GPC3 peptide and FI relative to untreated control HepG2 GPC3 knock out cells (Fig. 6C). (D) GPC3 protein expression in GPC3 KO cells show absence of expression in untreated control cells and expression of both 70 kDa and 40 kDa GPC3 in GPC3 KO cells treated with full-length GPC3 peptide. (E) Scratch assay performed on two HepG2 GPC3 KO clones demonstrates increased migration following q24 h FI treatment at 24 and 48 h compared to control GPC3 KO cells. Representative images shown (4x images, Nikon Ts2).
