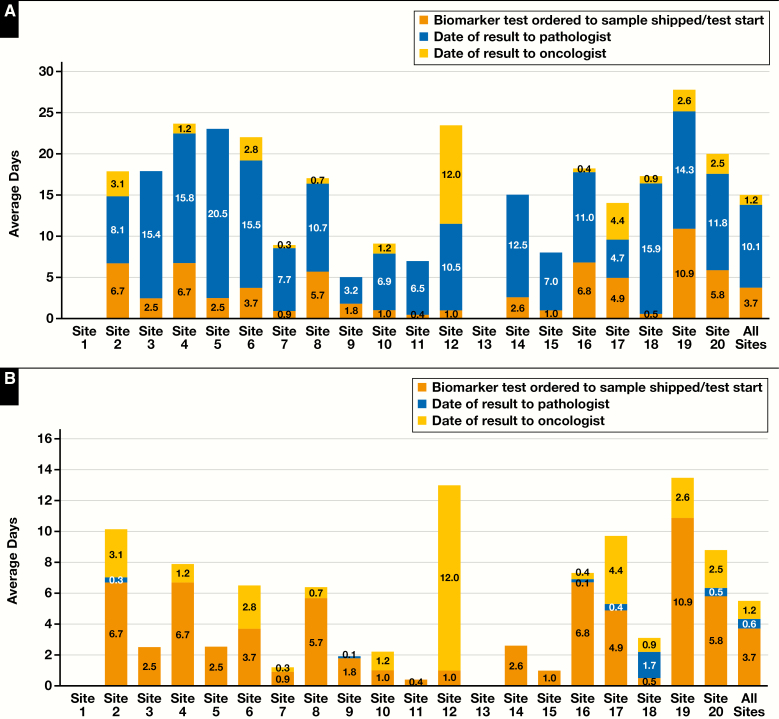
Figure 3.
A, Standard-of-care (SOC) RAS biomarker turnaround times for each study site and average timelines for sites that submitted data (n = 780). Timeline data were available for 18 of the 20 sites. Turnaround times were measured from biomarker testing ordered to sample shipped or testing started (BTO to SSTS), sample shipped or testing started to date of result to pathologist (SSTS to RTP), and date of result to pathologist to date of result to oncologist (RTP to RTO). B, Idylla RAS biomarker turnaround times for each study site and average timelines for sites that submitted data (n = 780). Timeline data were available for 18 of the 20 sites. Turnaround times for Idylla were created using a combination of SOC preanalytical and postanalytical testing timelines in conjunction with Idylla sample testing timelines. Preanalytical timelines were assumed to be the same as SOC for biomarker testing ordered to sample shipped or testing started (BTO to SSTS), and postanalytical timelines were assumed to be the same for SOC date of result to pathologist to date of result to oncologist (RTP to RTO). The sample shipped or testing started date to date of result to pathologist (SSTS to RTP) substituted the SOC actual testing times with the Idylla testing time on the corresponding sample.

