Figure 5.
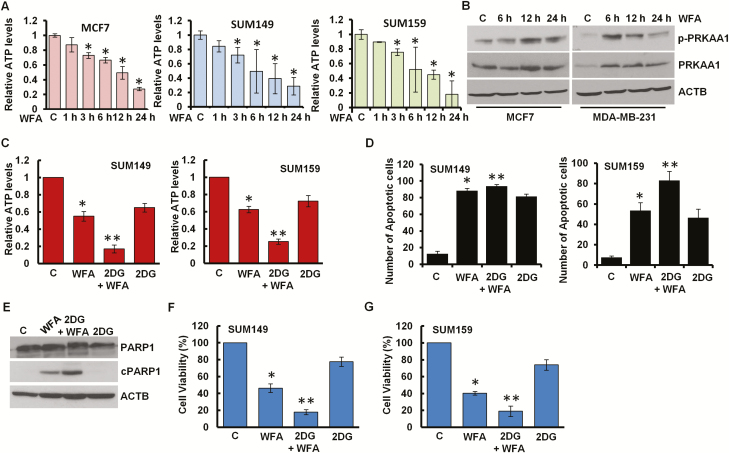
WFA induces energy impairment with AMPK activation. (A) Breast cancer cells were treated with 5 µM WFA for the indicated time intervals and intracellular ATP production was measured. Relative ATP levels are expressed with respect to the control. *P< 0.005, compared with control. (B) Breast cancer cells were treated with 5 µM WFA for indicated time intervals and total lysates were immunoblotted for phospho-PRKAA1 (p-PRKAA1) and total PRKAA1 (62 kDa) expression levels. ACTB (45 kDa) was used as loading control. (C) SUM149 and SUM159 cells were treated with 5 µM WFA alone or in combination with 2-DG as indicated. Intracellular ATP production was measured. Relative ATP levels are expressed with respect to the control. *P< 0.005, compared with control; **P< 0.01, compared with WFA alone. (D) SUM149 and SUM159 cells were treated with 5 µM WFA alone or in combination with 2-DG as indicated followed by Hoechst 33342 staining apoptosis detection. Mean number of apoptotic cells are presented in bar graphs. *P< 0.01, compared with control; **P< 0.01, compared with WFA alone. (E) Breast cancer cells were treated with 5 µM WFA alone or in combination with 2-DG as indicated. Total lysates were immunoblotted for the expression of cPARP1 (89 kDa) and PARP1 (116 kDa). ACTB (45 kDa) was used as loading control. (F, G) SUM149 and SUM159 cells were treated with 5 µM WFA alone or in combination with 2-DG as indicated and subjected to Trypan Blue exclusion assay. Bar graph shows percentage of alive cells. *P< 0.01, compared with control; **P< 0.005, compared with WFA alone.

