
FIGURE 2.
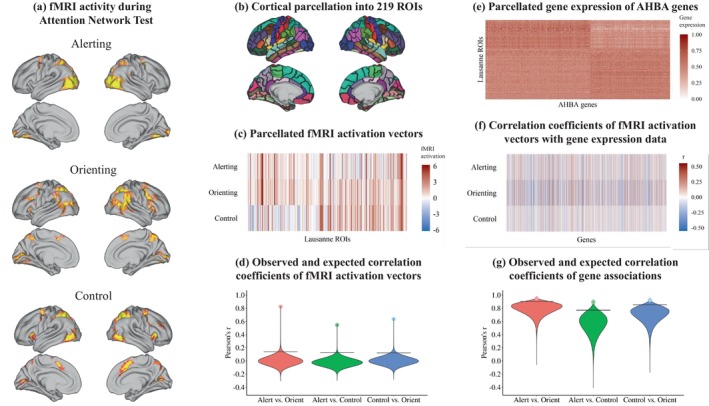
Outline of the step‐by‐step workflow for our analysis: Attention network maps (a) were parcellated into 219 regions using the Lausanne parcellation (b), generating one activation vector of length 219 for each attention network, displayed in panel (c). Functional overlap between attention network test (ANT) networks was evaluated by correlating the ANT brain activation vectors, displayed as dots in panel (d). Statistical significance of the correlations was evaluated by a spatial permutation test. The violins in panel (d) show the distributions of 2 million correlations obtained from spatially rotating the ANT activation vectors according to the spin‐test null model. Horizontal lines reflect the 95th quantiles of correlations expected under the null hypothesis. We then obtained regional gene expression data from the AHBA using the abagen pipeline. The matrix in panel (e) visualizes gene expression for a total of 15,632 genes, with values ranging from 0 to 1 across all 219 regions of the Lausanne parcellation. For visualization, the order of genes and ROIs was rearranged into two clusters. Associations between gene expression and ANT networks were evaluated by correlating the activation vectors from panel (c) with each of the 15,632 gene expression vectors in panel (e), yielding a correlation coefficient for each gene with the alerting, orienting, and control networks, displayed in panel (f). In a last step, we assessed the similarity between the gene expression associations of each attention network displayed in panel (f) by computing their pairwise correlation, shown as dots in panel (g). The violins show the distribution of two million correlations obtained from spatially rotating the ANT activation vectors (panel e) according to the spin‐test null model. Again, horizontal lines reflect the 95th quantiles of correlations expected under the null hypothesis.