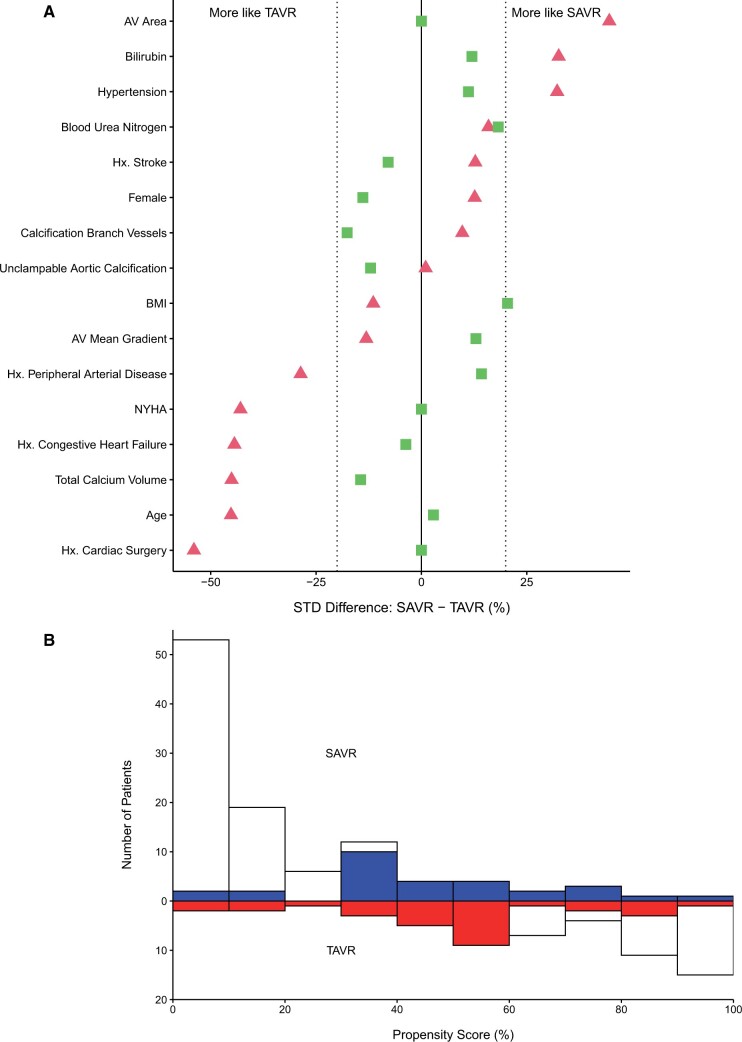
Figure 3:
Propensity score matching results for comparing outcomes of SAVR versus TAVR. AV: aortic valve; BMI: body mass index; Hx: history; NYHA: New York Heart Association Symptom Class; SAVR: surgical aortic valve replacement; TAVR: transcatheter aortic valve replacement. (A) Covariable balance for selected variables before (triangles) and after (squares) matching, contrasting characteristics of patients undergoing SAVR and TAVR. Values on the horizontal axis represent standardized difference. Triangles to the left of zero (negative) represent TAVR-like characteristics; triangles to the right of zero (positive) represent SAVR-like characteristics. (B) Mirror histogram of the distribution of propensity scores for SAVR (bars above zero line) and TAVR (bars below zero line) approaches. Shaded areas represent 29 matched patient pairs. Unshaded areas represent unmatched patients (SAVR, N = 76; TAVR, N = 30).

