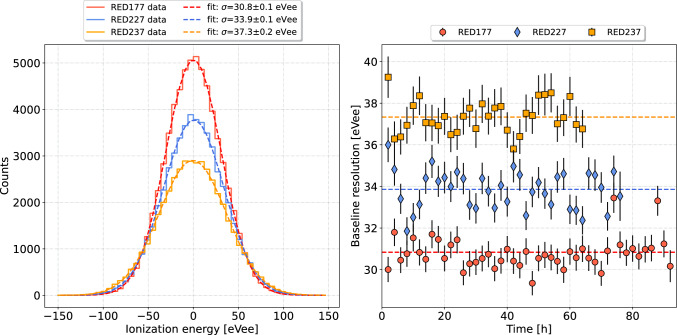
Fig. 4.
Left: Energy distributions of noise traces for all three detectors RED177 (red), RED227 (blue), and RED237 (orange) obtained from continuous data acquisitions of 92 h, 75 h, and 65 h, respectively. The resulting average baseline ionization resolutions (RMS) derived from a Gaussian fit (dashed curve) are: eVee (RED177), eVee (RED227), and eVee (RED237). Right: Time evolution of the observed baseline energy resolution for RED177, RED227, and RED237 leading to the energy spectra shown in Fig. 3

