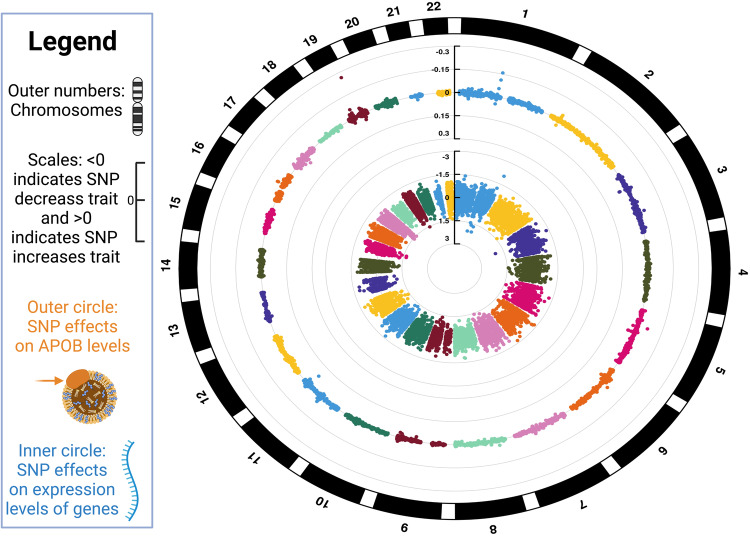
Fig. 7. Circos plot of the data for the summary-data Mendelian randomization (SMR) of genes whose expression influences apolipoprotein B (APOB) levels.
The plot depicts SNP effects on APOB (outer circle) and gene expression (inner circle). The vertical bars in the center with ranges indicate SNP effects. Values >0 indicate an increase in APOB (outer circle) and an increase in expression (inner circle). Conversely, values <0 indicate a decrease in APOB (outer circle) and a decrease in expression (inner circle). These are the data for summary-data based Mendelian randomization (SMR). 14,057 lead eQTLs (P < 5 x 10⁻⁶) were testable in relation to circulating APOB levels. We used these data to obtain the effect of gene expression on APOB levels by calculating Wald ratios for individual SNPs (i.e., dividing a SNP’s effect on APOB by a SNP’s effect on gene expression). See Supplementary Data 14 for detailed SNP characteristics. The circos plot was created with CMplot62.

