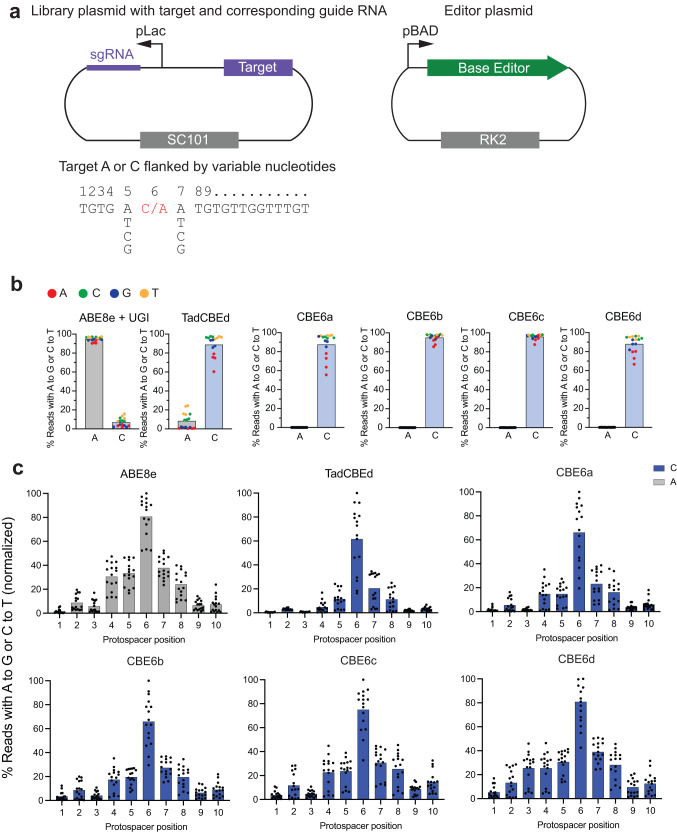
Fig. 2. Profiling the activity and sequence context specificity of CBE6 variants in E. coli.
a Schematic of a 32-member library that varies the 5’ and 3’ sequence contexts of a target edit at position 6 within the editing window of an E. coli protospacer. b Bar values indicate the average activity of CBE variants when tested on a library of 32 substrates designed to contain the target base (A or C) at protospacer position 6 with all possible combinations of flanking nucleotides. Dots represent the average percentage of sequencing reads containing the specified edit (A•T-to-G•C or C•G-to-T•A) for each of the 16 sequence contexts (each dot represents an average of n = 3 independent biological replicates). The dots are colored according to the 5′ upstream base (A, red; C, green; G, blue; T, yellow). c Bar values indicate the average C•G-to-T•A editing efficiency of CBE variants or A•T-to-G•C activity of ABE8e when tested on a library of 448 substrates designed to contain the target base (A or C) at protospacer positions 1-10 with the 5′ and 3′ base varied as A, T, C, or G, normalized to the highest C•G-to-T•A activity for CBE variants or A•T-to-G•C activity for ABE8e. Dots represent the average percentage of sequencing reads containing the specified edit (A•T-to-G•C or C•G-to-T•A) for each of the 224 sequence contexts (each dot represents an average of n = 2 independent biological replicates). Full data for C•G-to-T•A and A•T-to-G•C activity are provided in Supplementary Figs. 8 and 9. Source data are provided as a Source Data file.

